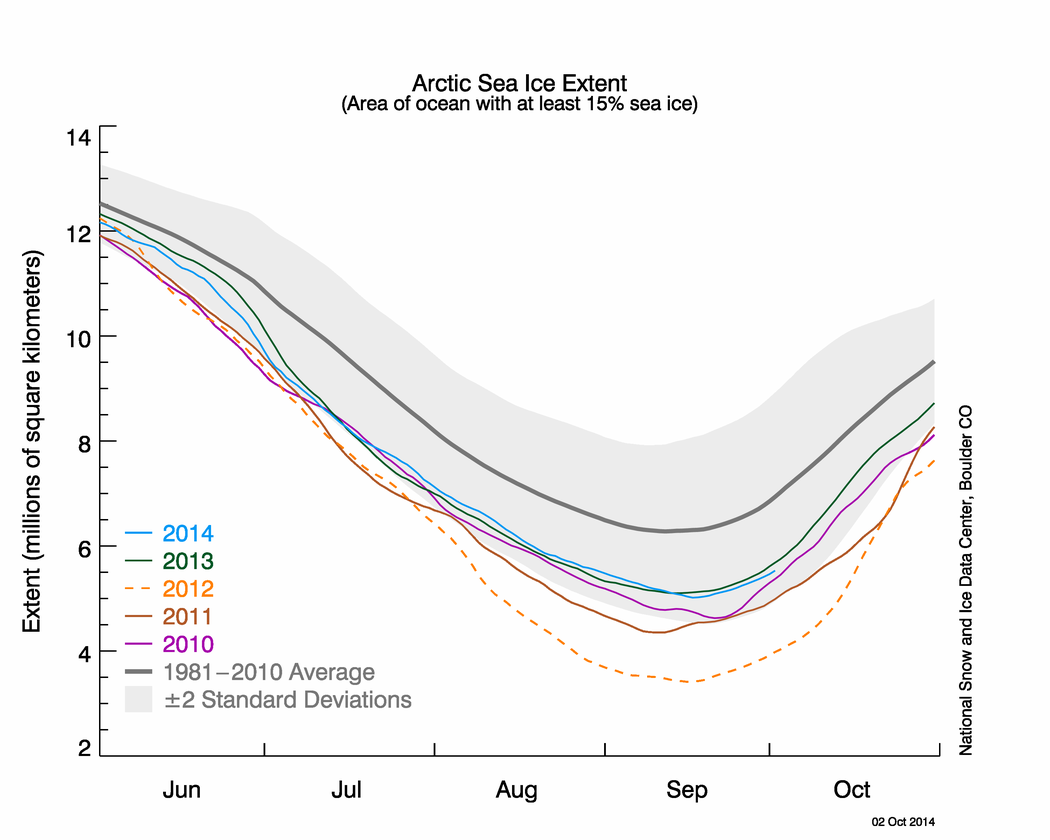
Figure 2. The graph above shows Arctic sea ice extent as of October 2, 2014, along with daily ice extent data for four previous years. 2014 is shown in blue, 2013 in green, 2012 in orange, 2011 in brown, and 2010 in purple. The 1981 to 2010 average is in dark gray. The gray area around the average line shows the two standard deviation range of the data. Sea Ice Index data.
Credit: National Snow and Ice Data Center
High-resolution image
Arctic: Following the seasonal daily minimum of 5.02 million square kilometers (1.94 million square miles) that was set on September 17, 2014 (6th lowest in the satellite record), Arctic sea ice has started its seasonal cycle of growth. Arctic sea ice extent averaged for the month of September 2014 was 5.28 million square kilometers (2.04 million square miles), also the 6th lowest in the satellite record. This is 1.24 million square kilometers (479,000 square miles) below the 1981 to 2010 average extent, and 1.65 million square kilometers (637,000 square miles) above the record low monthly average for September that occurred in 2012.
…
Between the seasonal maximum extent that occurred on March 21, 2014 and the September 17 minimum, the Arctic Ocean lost a total of 9.89 million square kilometers (3.82 million square miles) of ice, which is the 9th largest in the satellite record, but the least amount of seasonal loss since 2006. This year’s loss was 1.92 million square kilometers 741,000 square miles) less than the total loss that occurred in 2012.
…
Through 2014, the linear rate of decline for September Arctic ice extent over the satellite record is 13.3% per decade, relative to the 1981 to 2010 average. The ten lowest September ice extents over the satellite record have all occurred in the last ten years.