Climate Depot Exclusive
CHICAGO — A prominent U.S. geologist is urging the world to forget about global warming because global cooling has already begun.
Geologist Dr. Don Easterbrook’s warning came in the form of a new scientific paper he presented to the 4th International Conference on Climate Change in Chicago on May 16, 2010. Dr. Easterbrook is an Emeritus Professor at Western Washington University who has authored eight books and 150 journal publications. Easterbrook’s full resume is here.
Dr. Easterbrook joins many other scientists, peer-reviewed research and scientific societies warning of a coming global cooling. Easterbrook is presenting his findings alongside other man-made global warming skeptics at the three day conference in Chicago.
Dr. Easterbrook’s key excerpts:
That global warming is over, at least for a few decades, might seem to be a relief. However, the bad news is that global cooling is even more harmful to humans than global warming and a cause for even greater concern because:
1. A recent study showed that twice as many people are killed by extreme cold than by extreme heat.
2. Global cooling will have an adverse effect on food production because of shorter growing seasons, cooler growing seasons, and bad weather during harvest seasons. This is already happening in the Midwestern U.S., China, India, and other places in the world. Hardest hit will be third world countries where millions are already near starvation levels.
3. Increase in per capita energy demands, especially for heating.
4. Decrease in the ability to cope with problems related to the population explosion. World population is projected to reach more than 9 billion by 2050, an increase of 50%. This means a substantial increase in demand for food and energy at a time when both are decreasing because of the cooling climate.
CONCLUSIONS:
Numerous, abrupt, short-lived warming and cooling episodes, much more intense than recent warming/cooling, occurred during the last Ice Age, none of which could have been caused by changes in atmospheric CO2. .
Climate changes in the geologic record show a regular pattern of alternate warming and cooling with a 25-30 year period for the past 500 years.
Strong correlation between solar changes, the PDO, glacier advance and retreat, and global climate allow us to project a consistent pattern into the future.
Strong correlation between solar changes, the PDO, glacier advance and retreat, and global climate allow us to project a consistent pattern into the future.
Projected cooling for the next several decades is based on past PDO patterns for the past century and temperature patterns for the past 500 years. Three possible scenarios are shown: (1) global cooling similar to the global cooling of 1945 to 1977, (2) global cooling similar to the cool period from 1880 to 1915, and (3) global cooling similar to the Dalton Minimum from 1790 to 1820.
Expect global cooling for the next 2-3 decades that will be far more damaging than global warming would have been.
Short Summary of Dr. Easterbrook’s new paper:
THE LOOMING THREAT OF GLOBAL COOLING
Geological Evidence for Prolonged Cooling Ahead and its Impacts
Prof. Don J. Easterbrook
Dept. of geology — Western Washington University — Bellingham, WA 989225
The past is the key to the future–To understand present-day climate changes, we need to know how climate has behaved in the past. In order to predict where we are heading, we need to know where we’ve been. Thus, one of the best ways to predict what climate changes lay ahead is to look for patterns of past climate changes.
Numerous, abrupt, short-lived warming and cooling episodes, much more intense than recent warming/cooling, occurred during the last Ice Age and in the 10,000 years that followed, none of which could have been caused by changes in atmospheric CO2 because they happened before CO2 began to rise sharply around 1945. This paper documents the geologic evidence for these sudden climate fluctuations, which show s remarkably consistent pattern over decades, centuries, and millennia.
Among the surprises that emerged from oxygen isotope analyses of Greenland and Antarctic ice cores was the recognition of very sudden, short–lived climate changes. The ice core records show that such abrupt climate changes have been large, very rapid, and globally synchronous. Climate shifts, up to half the difference between Ice Age and interglacial conditions, occurred in only a few decades.
Ten major, intense periods of abrupt climate change occurred over the past 15,000 years and another 60 smaller, sudden climate changes have occurred in the past 5000 years. The intensity and suddenness of these climatic fluctuations is astonishing. Several times, temperatures rose and fell from 9–15° F in a century or less.
The dramatic melting of continental glaciers in North America, Europe, and Asia that began 15,000 years ago was interrupted by sudden cooling 12,800 years ago, dropping the world back into the Ice Age. Continental and alpine glaciers all over the world ceased their retreat and re-advanced. This cold period, the Younger Dryas, lasted for 1300 years and ended abruptly with sudden, intense warming 11,500 years ago. The climate in Greenland warmed about 9° F in about 30 years and 15° F over 40 years. During the Younger Dryas cold period, glaciers not only expanded significantly, but also fluctuated repeatedly, in some places as many as nine times.
Temperatures during most of the last 10,000 were somewhat higher than at present until about 3,000 years ago. For the past 700 years, the Earth has been coming out of the Little Ice Age and generally warming with alternating warm/cool periods.
Both Medieval Warm Period and Little Ice Age have long been well established and documented with strong geologic evidence. Georef lists 485 papers on the Medieval Warm period and 1413 on the Little Ice Age for a total of 1,900 published papers on the two periods. Thus, when Mann et al. (1998) contended that neither event had happened and that climate had not changed in 1000 years (the infamous hockey stick graph), geologists didn’t take them seriously and thought either (1) the trees they used for their climate reconstruction were not climate sensitive, or (2) the data had been inappropriately used. As shown in the 1,900 published papers, the Medieval Warm Period and Little Ice Age most certainly happened and the Mann et al. ‘hockey stick’ is nonsense, not supported by any credible evidence.
The oxygen isotope record for the Greenland GISP ice core over the past 500 years shows a remarkably regular alternation of warm and cool periods. The vertical blue lines at the bottom of the graph below show the time intervals between each warm/cool period. The average time interval is 27 years, the same as for time intervals between Pacific Ocean warm and cool temperatures as shown by the Pacific Decadal Oscillation (see below)
Global warming is real, but it did not begin in 1945 at the time of greatly increased CO2 emissions. Two periods of global warming (1915–1945 and 1977–1998), and two periods of global cooling (1880–1915 and 1945–1977) occurred in the 20th century. Atmospheric CO2 began to rise sharply right after WWII in 1945 but was accompanied by global cooling for 30 years, rather than by warming, and the earlier warm period from 1915 to 1945 took place before CO2 began to rise significantly.
During each of the two warm periods of the past century, alpine glaciers retreated and during each of the two cool periods glaciers advanced. The timing of the glacier advances and retreats coincides almost exactly with global temperature changes and with Pacific Ocean surface temperatures (PDO).
The Pacific Ocean has two modes, a warm mode and cool mode, and regularly switches back and forth between modes in a 25-30 year repeating cycle known as the Pacific Decadal Oscillation (PDO). When the PDO is in its warm mode, the climate warms and when it is in its cool mode the climate cools. Glacier fluctuations are driven by climatic changes, which are driven by ocean surface temperatures (PDO).
During the cool PDO mode, ocean surface temperatures in the eastern Pacific are cool. This was typical of the global cooling from 1945 to 1977. During the warm PDO, ocean surface temperatures in the eastern Pacific are warm. This was typical of the global warming from 1977 to 1998. The abrupt shift of the Pacific from the cool mode to the warm mode in a single year (1977) and the beginning of the last warm cycle has been termed the “Great Pacific Climate shift.” There is a direct correlation between PDO mode and global temperature
The ocean surface temperature in the eastern Pacific off the coast of North America was warm in 1997. In 1999, the PDO switched from its warm mode to its cool mode and has since remained cool as shown by satellite imagery. Adding the PDO record for the past decade to the PDO for the century provides an interesting pattern. The PDO 1915–1945 warm mode, the 1945-1977 cool mode, the 1977-1998 warn mode, and the switch from warm to cool mode in 1999 all match corresponding global climate changes and strongly suggest:
1. The PDO has a regular cyclic pattern with alternating warm and cool modes every 25-30 years
2. The PDO has accurately matched each global climate change over the past century and may be used as a predictive tool.
3. Since the switch of the PDO from warm to cool in 1999, global temperatures have not exceeded the 1998 high.
4. Each time the PDO has changed from one mode to another, it has stayed in that mode for 25-30 years; thus, since the switch of the PDO from warm to cool in 1999 has been entrenched, it will undoubtedly stay in its cool mode for another several decades.
5. With the PDO in cool mode for another several decades, we can expect another several decades of cooling.
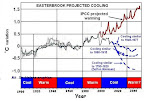
In 2000, the Intergovernmental Panel on Climate Change (IPCC) predicted global warming of1° F per decade and global warming of about 10° F by 2100. The red line on the graph below is their predicted temperature curve for 2000 to 2050. Note that by 2010, temperatures should be 1° F warmer than in 2000. That didn’t happen so their climate models failed to predict even 10 years ahead.
The blue curves of projected cooling are based on the past PDO patterns for the past century and temperature patterns for the past 500 years. Three possible scenarios are shown: (1) global cooling similar to the global cooling of 1945 to 1977, (2) global cooling similar to the cool period from 1880 to 1915, and (3) global cooling similar to the Dalton Minimum from 1790 to 1820.
The possibility of temperatures dropping to the level of the Dalton Minimum is suggested by the recent passing of the sun from a solar grand maximum to a solar grand minimum similar to that of the Dalton Minimum. The unusually long sun spot cycle 23 and the solar magnetic index suggest that a solar minimum similar to the Dalton is very possible. A fourth possibility is that we may be approaching another Maunder type minimum and another Little Ice Age. Time will tell which curve is correct.
IMPACTS OF GLOBAL COOLING
That global warming is over, at least for a few decades, might seem to be a relief. However, the bad news is that global cooling is even more harmful to humans than global warming and a cause for even greater concern because:
1. A recent study showed that twice as many people are killed by extreme cold than by extreme heat.
2. Global cooling will have an adverse effect on food production because of shorter growing seasons, cooler growing seasons, and bad weather during harvest seasons. This is already happening in the Midwestern U.S., China, India, and other places in the world. Hardest hit will be third world countries where millions are already near starvation levels.
3. Increase in per capita energy demands, especially for heating.
4. Decrease in the ability to cope with problems related to the population explosion. World population is projected to reach more than 9 billion by 2050, an increase of 50%. This means a substantial increase in demand for food and energy at a time when both are decreasing because of the cooling climate.
CONCLUSIONS
Numerous, abrupt, short-lived warming and cooling episodes, much more intense than recent warming/cooling, occurred during the last Ice Age, none of which could have been caused by changes in atmospheric CO2. .
Climate changes in the geologic record show a regular pattern of alternate warming and cooling with a 25-30 year period for the past 500 years.
Strong correlation between solar changes, the PDO, glacier advance and retreat, and global climate allow us to project a consistent pattern into the future.
Strong correlation between solar changes, the PDO, glacier advance and retreat, and global climate allow us to project a consistent pattern into the future.
Projected cooling for the next several decades is based on past PDO patterns for the past century and temperature patterns for the past 500 years. Three possible scenarios are shown: (1) global cooling similar to the global cooling of 1945 to 1977, (2) global cooling similar to the cool period from 1880 to 1915, and (3) global cooling similar to the Dalton Minimum from 1790 to 1820.
Expect global cooling for the next 2-3 decades that will be far more damaging than global warming would have been.