Search
Close this search box.

Search Results for: Antarctic

Study: Elevation Of Early Holocene’s W. Antarctic Ice Sheet Once Plunged 480 Meters In 200 Years — When CO2 levels were much lower than today – Dwarfing any retreat rates of modern era

The Elevation Of The Early Holocene’s W. Antarctic Ice Sheet Once Plunged 480 Meters In 200 Years By Kenneth Richard on 26. February 2024 Retreat rates for the West Antarctic Ice Sheet (WAIS) were massive during the Early Holocene, when CO2 concentrations were low and stable (~265 ppm), dwarfing any retreat rates witnessed in the modern era. New research published in Nature Geoscience (Grieman et al., 2024) assesses the elevation of West Antarctica’s ice sheet fell by ~480 m within just 200 years from about 8,000 to 8,200 years ago, a drop of more than 2 meters per year. The scientists also document an ice area retreat of 270 kilometers at the study site within only 400 years, from ~7,300-7,700 years ago. That’s an area retreat rate of about 675 meters per year. No modern WAIS recession rates are even remotely comparable to those achieved naturally during the Early to Mid Holocene. In fact, recent research (Zhang et al., 2023) indicates West Antarctica’s mean annual surface temperatures cooled by more than -1.8°C (-0.93°C per decade) from 1999-2018., which would preclude a recession of the WAIS linked to a surface warming trend. Image Source: Grieman et al., 2024

Antarctic Sea Ice Volume Greater Than The Early 1980s

Antarctic Sea Ice Volume Greater Than The Early 1980s By Paul Homewood There was much scaremongering from the alarmist community when Antarctic sea ice extent fell earlier in the year. As the Antarctic summer begins, the melt has slowed down, to the extent that extent is not even the lowest since 1979, and it is higher than in 2017:   https://zacklabe.com/antarctic-sea-ice-extentconcentration/ But much more important is the fact that sea ice volume remains higher than the early 1980s, thanks to the fact that it is much thicker than normal around the peninsula:  

New Study: Unprecedented mass gain over the Antarctic ice sheet between 2021 & 2022 – Published in Nov. 2023 – Environmental Research Letters

https://www.researchgate.net/publication/375133640_Unprecedented_mass_gain_over_the_Antarctic_ice_sheet_between_2021_and_2022_caused_by_large_precipitation_anomalies “The Antarctic Ice Sheet (AIS) showed a record-breaking mass gain of 129.7 ± 69.6 Gt/yr between 2021 and 2022. During this period, the mass gain over the East AIS and Antarctic Peninsula was unprecedented within the past two decades, and it outpaced the mass loss in the Amundsen sector of the West AIS from 2003 to 2022.”

2018 Studies: Three Studies Confirm Volcanism Is Melting West Antarctic Glaciers, Not Global Warming

https://www.plateclimatology.com/three-new-studies-confirm-volcanism-is-melting-west-antarctic-glaciers-not-global-warming by James Kamis Three new research studies confirm that geothermal heat flow, not man-made global warming, is the dominant cause of West Antarctic Ice Sheet (WAIS) melting, greatly strengthening the basic premises of Plate Climatology Theory. Figure 1: Outlined in red is West Antarctica’s subglacial Marie Byrd bedrock mantle plume “hotspot”. Red shading shows West Antarctic Ice Sheet (WAIS) thinning from 1992 to 2017 (credit research study to NASA, mantle plume outline by J. Kamis). JUNE 22, 2018, RESEARCH STUDY This study, entitled “Evidence of an active volcanic heat source beneath the Pine Island Glacier“, proves that the Pine Island Glacier of West Antarctica is melting and retreating from geothermal heat from a currently active subglacial volcano, not man-made global warming. See NSF’s press release here. A previous Climate Change Dispatch (CCD) article posted on December 5, 2014, illustrated the presence of glacial ice melting from bedrock heat flow in the Pine Island Glacial Valley (see here). Figure 2 is taken from a 2017 CCD article that shows the active geothermal heat sources in the Pine Island Glacial Valley, specifically the Hudson Mountain Volcanic Region, the Mount Takahe Volcanic Region, and a series of linear north- and south-oriented valleys created by deep-earth faults that are part of the giant West Antarctic Rift System. Figure 2: Bedrock geological setting of the Pine Island Glacier area. The conclusions of the June 22, 2018, research study, which cites bedrock geothermal heat flow as the root cause of Pine Island Glacier melting, constitute a major setback for the idea that man-made atmospheric global warming is driving this ice melting. JUNE 21, 2018, RESEARCH STUDY This research study entitled “Bedrock in West Antarctica rising at a surprisingly rapid rate” shows that the very well-defined Marie Byrd bedrock mantle plume “hotspot” (MB plume) region is rapidly rising and forming an extensive high elevation dome. Figure 3: Illustration of flowing water under the Antarctic ice sheet. Blue dots indicate lakes, lines show rivers. Marie Byrd Land is part of the bulging “elbow” leading to the Antarctic Peninsula, left-center. Credit: NSF/Zina Deretsky The Technical University of Demark (TUD) spearheaded the study which concluded that rapid elevation rise of the MB plume region is the result of post-glacial rebound. Post-glacial rebound is a bedrock uplift process that occurs when a thick ice column is greatly reduced or completely removed by melting. In the case of complete ice column removal, downward pressure on the underlying bedrock is significantly decreased thereby allowing the bedrock to rebound upward, in some cases to its original pre-glaciation elevation position. There are several problems with invoking post-glacial rebound as the cause of the MB plume region bedrock uplift. First, by carefully analyzing data from the TUD study it can be shown that the rate of bedrock elevation rise rate in the MB plume region is abnormally high when compared to normal post-glacial rebound rates. Normal rebound rates are 25 millimeters per year. The MB plume area is rising at 41 millimeters per year, well above the normal rate. TUD scientists said the following about this abnormally high elevation rise rate…“The earth is rising in one part of Antarctica at one of the fastest rates ever recorded…” (see here). It is here likely that the rapid elevation rise rate of the MB plume region is caused by the uplifting action of geological forces. and not post-glacial rebound. Second, West Antarctica is still covered by an average 8,200 feet (1.6 miles) of glacial ice. This ice column exerts a downward pressure onto the underlying bedrock of approximately 200 tons per square foot. Certainly, the TUD research folks have run computer models to explain how post-glacial rebound functions in this thick ice column case. However, utilization of computer modeling by climate scientists has consistently failed for 20 years. Healthy skepticism is proper in this case. Third, and most telling, the uplifted area matches both the high-heat flow of the MB plume and the WAIS thinning (see Figure 1 atop this article). This strongly indicates a cause and effect relationship between elevation rise and MB plume activity. The upward forces and surface lava emissions from mantle plumes are capable of rapidly uplifting enormous geographic regions. You may have heard of one, it’s called Iceland. The Iceland/Greenland mantle plume is actively uplifting and adding layers of lava flows to Iceland thereby increasing the elevation of this geologically active island. It is here contended that the high elevation rise rate of West Antarctica’s MB plume region is the result of geothermal bottom melting of the ice column and upward bulging of the bedrock related to the MB plume and not post-glacial rebound. Additional information concerning the geologically active Marie Byrd bedrock mantle plume “hotspot” and the giant deep-earth fault that fuels this plume and over a 100 subglacial volcanoes can be found at these previous Climate Change Dispatch articles (see here, here, here, here, and here). JUNE 13, 2018, RESEARCH STUDY This study, entitled “New study suggests surprising wrinkle in the history of West Antarctic Ice Sheet”, proves that the WAIS significantly melted and retreated 10,000 years ago, then quickly recovered to its full extent (see Figure 4). An event that obviously pre-dates human involvement. Additionally, neither this study or other previous studies have found evidence that the giant East Antarctic Ice Sheet (EAIS) retreated during the same ancient time frame. This information strongly indicates that ancient ice melting of the WAIS is almost certainly related to underlying bedrock geothermal heat flow from geographically specific geological features and not worldwide atmospheric global warming. It’s difficult, if not impossible, for atmospheric warming to significantly melt the WAIS while not melting the adjacent EAIS. Active geological features 10,000 years ago include the 5,300-mile-long deep-earth West Antarctic Rift System, which was formed approximately 150 million years ago and is still active today, and the previously mentioned MB plume, which is likely part of Pacific Ring of Fire (see here). Figure 4: Map illustrating the 10,000-year-old West Antarctic Ice Sheet retreat and its current position (credit NIU et al.). SUMMARY By combining the data and conclusions of three brand new research studies with very telling older research studies and previous CCD articles, it becomes very clear that melting of West Antarctica’s Ice Sheet is the result of bedrock geothermal heat flow, not atmospheric global warming. Climate scientists strongly advocating the theory of the global warming to explain the WAIS melting should broaden their research and analyzation process to include the impact of geological forces, like subglacial volcanoes. It’s time for all of us to help these well-intentioned scientists achieve this goal.

CNN Peddles False Alarm About Western Antarctica Melting

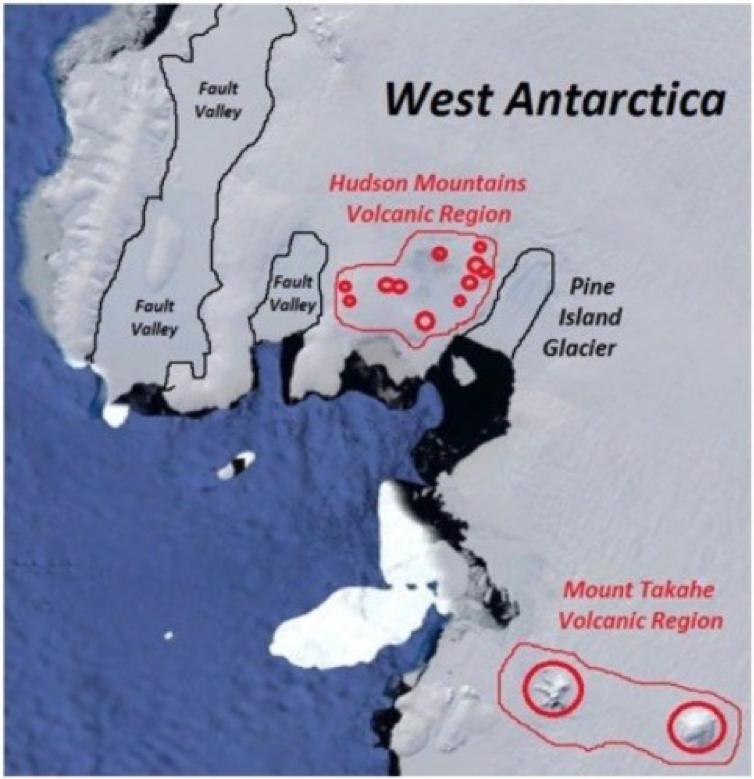
https://climaterealism.com/2023/10/cnn-peddles-alarm-about-western-antarctica-melting/ By Linnea Lueken A recent article posted by CNN claims that western Antarctica is melting rapidly and can’t be stopped, due to human-caused global warming, which will result in a dangerous rise ocean levels. This is false. While the West Antarctic Ice Sheet (WAIS) has seen more melting than other parts of the continent, it is due not to climate change but rather to localized temporary weather conditions and ongoing subsurface volcanic activity below the ice sheet. Indeed, outside of West Antarctica and the Antarctic peninsula, the larger part of the continent has gained ice mass in recent decades and has actually experienced a cooling trend. The article, “Rapid melting in West Antarctica is ‘unavoidable,’ with potentially disastrous consequences for sea level rise, study finds,” says that West Antarctica’s ice shelves are melting rapidly, and probably can’t be stopped. CNN claims this will lead to “potentially devastating implications for sea level rise around the world,” citing a recent study in Nature Climate Change. The study’s authors claim that even if the world were to meet emissions and warming targets, like limiting warming to 1.5°C above pre-industrial global average temperature, the WAIS will still experience “substantial ocean warming and ice shelf melting[.]” The study’s authors considered most WAIS melting to be due to “basal melting,” due to warm ocean currents that heat the ice from below. It is notable that they do not consider subsurface geothermal heating from volcanic activity below the ice as a potential contributor, especially since several recent studies suggest that the WAIS, particularly around the Thwaites glacier, sits on top of a large number of subsurface volcanoes which are believed to be contributing to melting below the ice and localized increased water temperatures. There is also a question as to whether or not Antarctica has seen much – if any – warming at all over the past 70 years, as discussed in the Climate Realism post “South Pole Warming Claims Contradicted by Actual Temperature Measurements.” According to NASA data, there was even some cooling between the early 2000s and 2019. Basal melting, then, really is the best explanation, but only appears to be occurring in the WAIS, because the rest of the continent has seen a gain in ice mass in its interior. Sea ice itself melting cannot contribute to sea level rise, since it is already displacing water, but the Nature Climate Change study’s authors explain that the melt of the sea ice can cause land ice to shift forward and likewise melt into the warmer waters. This makes sense and likely occurs; but the recorded interior ice mass gain makes it unclear whether there is a net loss of ice for Antarctica as a whole, and if so, by how much and at what rate, making claims about rising seas extremely uncertain. Data contained in a recent study even shows that Antarctica has seen a small expansion of sea ice in total over the past seven decades, providing a compelling visual demonstration of the continent’s recent cooling trend. (See graphic below) From Singh and Polvani, 2020, here: https://www.nature.com/articles/s41612-020-00143-w Indeed, the authors of the Nature Climate Change study themselves admit that their modeling suggested “internal climate variability will be extremely important in determining the future of the WAIS.” Perhaps because this admitted uncertainty fails to advance the climate crisis narrative CNN consistently pushes, the news outlet did not quote from that portion of the study, and seemingly ignored its role in Antarctica’s net ice balance. In the implications section, the authors explain that they only focused on a single ice-ocean model and a single climate model, in the process ignoring many other potential feedbacks. They also said that increased snowfall could actually offset sea level rise, which tracks with the ice mass gain in the interior as discussed. In any case, the study authors say adaptation should be a major focus when it comes to sea level rise over the next several centuries. Most notably, “[i]nternal climate variability, which we cannot predict or control, may be the deciding factor in the rate of ice loss during this time.” Using only a single model, and including woefully flawed RCP8.5 scenario among those examined undercuts any confidence one might have in the accuracy of the study’s predictions. Regarding “dangerous” sea level rise, again Antarctica’s contributions are uncertain. If, as some studies show, the interior and eastern portions are gaining ice even as the WAIS suffers some melt, the continent may not contribute very much at all. The authors acknowledge this. Regardless, adaption to sea level rise is something that city planners and developers should take into account, because as discussed in Climate Realism here, here, and here, sea levels are rising in some areas, and if there is ice melt as the planet modestly warms, we can expect this trend to continue, albeit at a less alarming pace than some in the media would have us believe. Despite the paper acknowledging significant uncertainties, one of the study’s authors claimed that we have “lost control” of west Antarctic melting. This is pure hyperbole because humanity never had such control. The underlying paper cited by CNN displayed at least a modicum of caution and restraint. Sadly, CNN, in reporting on it, did not do the same. Rather they used some of its authors’ too-eager willingness to catastrophize in order to paint a picture of climate doom stemming from human fossil fuel use.  

New Study Finds Most Of Antarctica Has Cooled By Over 1°C Since 1999…W. Antarctica Cooled 1.8°C

New Study Finds Most Of Antarctica Has Cooled By Over 1°C Since 1999…W. Antarctica Cooled 1.8°C By Kenneth Richard on 6. November 2023 Significant 21st century cooling in the Central Pacific, Eastern Pacific, and nearly all of Antarctica “implies substantial uncertainties in future temperature projections of CMIP6 models.” – Zhang et al., 2023 New research indicates West Antarctica’s mean annual surface temperatures cooled by more than -1.8°C (-0.93°C per decade) from 1999-2018. In spring, the West Antarctic Ice Sheet (WAIS) cooling rate reached -1.84°C per decade. Not only has the WAIS undergone significant cooling in the last two decades, most of the continent also cooled by more than 1°C. See, for example, the ~1°C per decade cooling trend for East Antarctica (2000 to 2018) shown in Fig. ES1. Of 28 CMIP6 models, none captured a cooling trend – especially of this amplitude – for this region. This modeling failure “implies substantial uncertainties in future temperature projections of CMIP6 models.” Image Source: Zhang et al., 2023 The post-1999 cooling trend has not just been confined to Antarctica. Sea surface temperatures (SSTs) in the Eastern and Central Pacific (south of 25°N) also cooled from 1999-2018 relative to 1979-1997. This cooling encompasses nearly half of the Southern Hemisphere’s SSTs. Image Source: Zhang et al., 2023 The 1999-2018 mean annual surface temperature cooling of the Antarctic continent and nearly half of the Southern Hemisphere’s SSTs do not support the claims that surface warming is driven by human emissions of greenhouse gases (GHGs). After all, if the widespread cooling cannot be explained by the increase in GHG forcing, why would the same concentrations of GHGs explain the areas with warming temperatures?

‘Mind-blowing’ Claims of Record Low Antarctica Sea Ice on BBC Contradicted by Statements Made Seven Years Ago

Dr. Walter Meier was part of the science team that cracked open the secrets of the early Nimbus data that revealed significant Antarctica sea ice variability in the 1960s, including a high in 1964, not seen again until 2014, and the low for 1966. This is what he told NASA Earth Data in 2016:

“Even in the passive microwave record [available since 1979] for the Antarctic you see these seesaws where the ice concentrations go up and down, so extreme high or extreme low are not that unusual. What the Nimbus data tell us is there’s variability in the Antarctica sea ice that’s larger than any we had seen from the passive microwave data. Nimbus helps put this in a longer term context and extends the record.”

Media’s latest Antarctic ice scare debunked – It is ‘frankly a con’

https://notalotofpeopleknowthat.wordpress.com/2023/10/14/antarcticas-melting-ice-shelves-have-unleashed-7-5-trillion-tonnes-of-water-into-the-oceans-since-1997-daily-mail/ Antarctica’s melting ice shelves have unleashed 7.5 TRILLION tonnes of water into the oceans since 1997–Daily Mail By Paul Homewood We’re all going to drown – Part 94 Over the last 25 years, Antarctica’s melting ice sheets have released a staggering 7.5 trillion tonnes of water into the ocean, a study has revealed. Analyzing over 100,000 satellite radar images, researchers from the University of Leeds discovered a steady erosion of the continent’s ice sheets, with over 40 per shrinking between 1997 and 2021. While some ice sheets did grow in size during this time, the data revealed that a third have now lost more than 30 per cent of their initial mass – unleashing vast quantities of freshwater in the process. Worryingly, scientists say this vast release of fresh water could threaten to destabilise ocean currents and contribute to global sea level rise. What’s more, human-induced climate change means that ice melt will continue to happen faster in the future, the experts warn. The scientists found that, while almost all the ice sheets on the east coast were melting, many ice sheets on the west coast stayed the same size or grew. This is due to the patterns of ocean currents which surround Antarctica, carrying water of different temperatures. While the Western side is exposed to warm waters which erode the ice shelves from below, East Antarctica is protected by a band of colder water close to the shore. Overall, 59 trillion tonnes of water have been added to the continent’s ice shelves since 1975. However, this was offset by the 67 trillion tonnes that were lost.  The biggest losses took place at the Getz Ice Shelf, which lost 1.9 trillion tonnes of water. For perspective, one trillion tones of ice would make a cube more than six miles (10 km) in every direction – more than half a mile taller than Mt Everest! Of this loss, 95 per cent was caused by melting and five per cent by ‘calving’, where large chunks of ice break off into the ocean. Meanwhile, on the other side of Antarctica, the Amery Ice Shelf gained 1.2 trillion tonnes of ice due to the colder waters surrounding it. https://www.dailymail.co.uk/sciencetech/article-12622893/Antarcticas-melting-ice-shelves-unleashed-7-5-TRILLION-tonnes-water-oceans-1997-study-finds.html#comments # Paul Homewood comments:  What this study does not mention is the fact that trillions of tonnes of ice are lost every year, due to both calving and melt. That is what ice sheets and glaciers do. And the loss is replenished by snowfall over the Antarctic continent. So to argue that the influx of freshwater could destabilise ocean currents is frankly a con. And as ever with these Antarctic studies, there is data prior to the handful of recent years, which are a mere speck in time. So we don’t know if any of this is out of the ordinary. What is interesting though is this figure from the actual paper: https://www.science.org/doi/10.1126/sciadv.adi0186 Now let’s home in on the top right graph: We can see that the Total Mass Change (black line) has remained stable since around 2000. If anything it has risen slightly. This actually corroborates another study in May this year, which found that the Antarctic ice shelf had grown between 2009 and 2019. All of the decline took place between 1997 and 2001. Whatever happened back then, and there must be question mark over the quality of the data then, it certainly is not occurring now, although there are evidently regional variations. Also note the massive margins of error. We actually don’t know whether the ice sheets are growing, shrinking or staying the same. This in itself makes the whole study meaningless. But no doubt it will generate lots more grant money for “further research”!

Analysis: Antarctic sea ice extent ‘record low’ due to ‘wind patterns’ – ‘Sea ice is actually thicker than normal’ as ‘the ice edge’ being ‘squeezed closer together’ – Sea ice volume ‘is NOT lowest on record’

https://notalotofpeopleknowthat.wordpress.com/2023/07/28/antarctic-sea-ice-volume/ Antarctic Sea Ice Volume JULY 28, 2023 By Paul Homewood h/t Euan Mearns As we know, Antarctic sea ice extent has been at record lows recently: https://nsidc.org/data/seaice_index # Paul Homewood: As I surmised yesterday, the ice retreat may be due to wind patterns, which blow the ice towards the pole. This is something which often happens in the Arctic. And back in 2016, the NSIDC commented about exactly this phenomenon, which was associated with the Southern Annular Mode: https://notalotofpeopleknowthat.wordpress.com/2016/12/14/antarctic-sea-ice-retreats-due-to-wind-patterns/ It is therefore appropriate to look at ice volume and thickness, as well as extent. The charts below are produced by Zach Lane, a NOAA scientist. The first chart tells a completely different story to the media narrative of a melting Antarctic. As you can see, most of the sea ice is actually thicker than normal. This is clear evidence of the ice edge being pushed polewards, squeezed closer together if you like: https://zacklabe.com/antarctic-sea-ice-extentconcentration/ The second image shows that, although ice volume is much less than average, it is NOT the lowest on record. The record low appears to be from the 1980s, though it is not clear which year. What is noticeable though is that, apart from this year, most of the low volume years are coloured blue (1980s and 90s), whilst the top years are all recent: The final chart is most the revealing of all. We can clearly see that the lowest volumes were around 1980 and 1981; also the trend was steadily increasing till it hit a record high in 2014. This was followed by the drastic drop in 2016, when, according to NSIDC, the SAM flipped. Since 2016, little has changed in overall terms: # Related: CNN 2021: Antarctica’s last 6 months were the coldest on record –  October 9, 2021 – By Allison Chinchar, CNN Meteorologist

For more results click below