What Warming? The First Blooming Date For Trees In Beijing Occurs No Earlier Today Than A.D. 1741-1795
The day of the year that a plant first blooms is widely considered to be “an important natural indicator of climate change” when observed over the course of decades to centuries. A new study (Liu et al., 2018) reveals that a flowering plant in Beijing, the Amygdalus davidiana, has not been blooming any earlier in recent decades than it did during the second half of the 18th century.
The scientific literature is teeming with temperature reconstructions that depict a glaring lack of unprecedented, remarkable, or even detectable warming at sites all across the globe. Hundreds of non-warming/non-hockey stick graphs have been published just since 2017 alone.
And when it comes to temperature reconstructions, one geographical region has seemed to receive more attention than any other: China.
Reconstructions of regional China temperatures consistently do not support the position that the modern period falls outside the range of natural variability.
In fact, in the first half of 2018 alone, there have already been 17 scientific papers published documenting a lack of conspicuous modern warming for regional China.
Directly Measuring Temperature/Climate With Blooming Dates
Unlike other temperature proxies used to reconstruct past temperatures, the day of the year a plant or tree blooms can be directlyconnected to the regional temperature. Cooler temperatures translate to delayed bloom dates, and warmer temperatures indicate earlier bloom dates. Compiled over decades to centuries, records of blooming dates can clearly depict long-term climate trends, as demonstrated in Liu and Fang (2017):
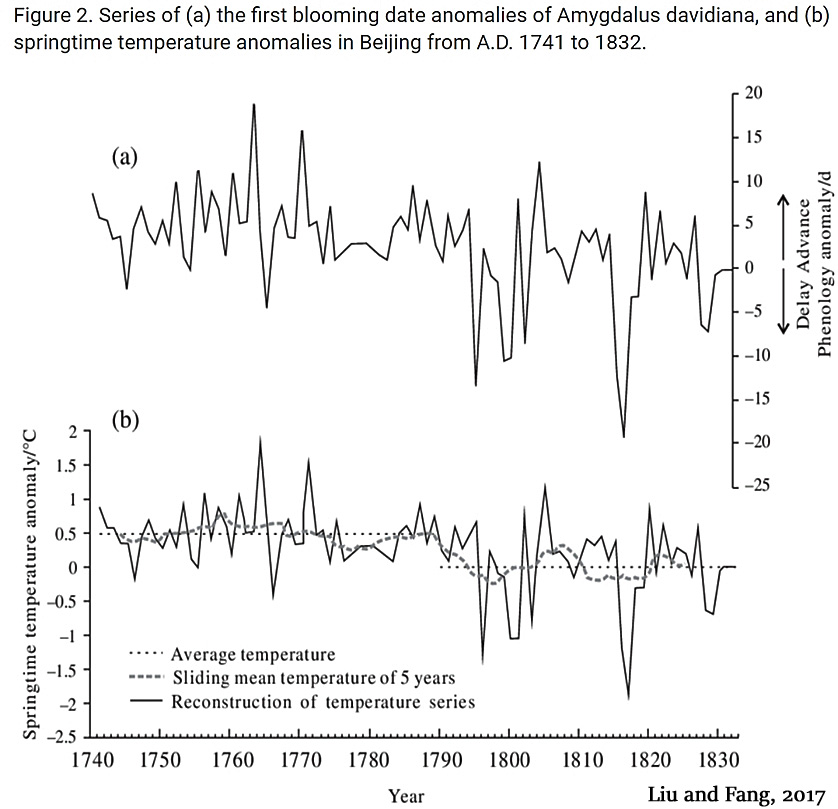
Graph Source: Liu and Fang, 2017
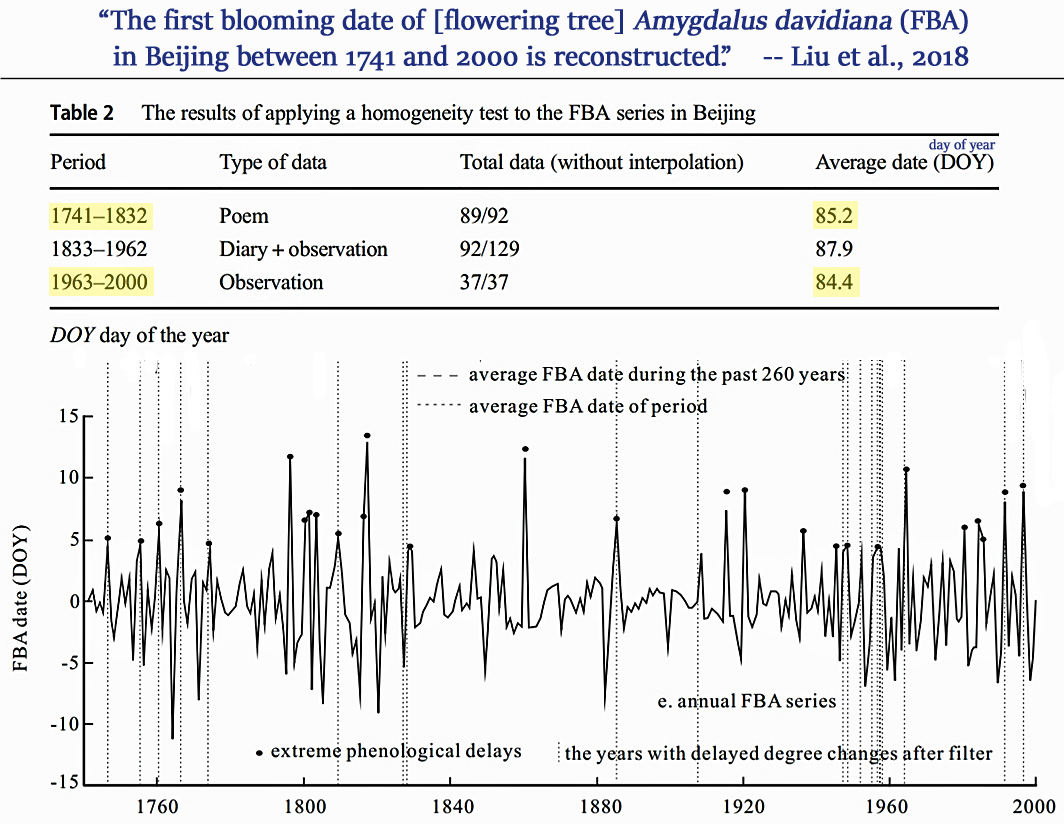
In a new study, Liu et al. (2018) obtained records of blooming dates for flowering trees in Beijing during the 260 years between 1741 and 2000. Consistent with many other recent paleoclimate reconstructions for the region, Liu et al. (2018) did not assess any significant differences between the first blooming dates in the second half of the 18th century (1741-1795) compared to the late 20th century (1963-2000).
In fact, even when including the delayed blooming dates (shown above) during the 1796-1832 period (attributed to that colder period’s higher volcanic activity and lower solar irradiance), the average day-of-year first blooming dates during the 90 years between 1741-1832 were effectively identical to the day-of-year first blooming dates for 1963-2000 (85.2 vs. 84.4).
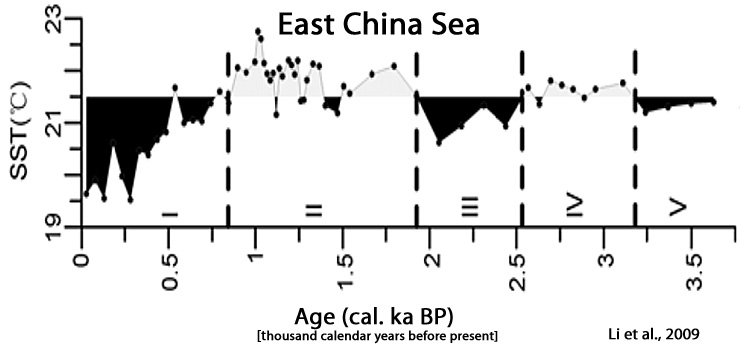
“No global climate warming due to the greenhouse effect since the Industrial Revolution occurs in the study area” (Li et al., 2009)
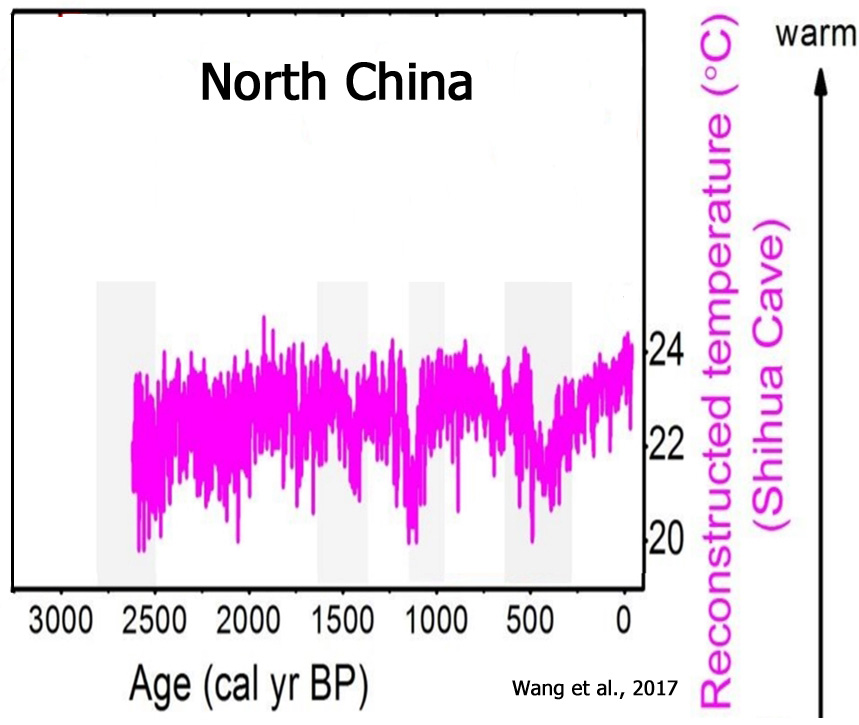
As mentioned above, an abundance of proxy reconstructions from the region also show the modern period is no warmer — and even several degrees colder — than it has been for the last several centuries to millennia.
Therefore, it appears to be widely accepted in the scientific literature that China has not been impacted by dangerous or unprecedented “global” warming since the 18th century, or since CO2 concentrations began rising precipitoously.
Liu et al., 2018
Extreme phenophase delays and their relationship with
natural forcings in Beijing over the past 260 years
“Plant phenology is an important natural indicator of climate change(Körner and Basler 2010) and a proxy for climate reconstruction (Ge et al. 2008; Zheng et al. 2015; Fang and Chen 2015). … In this paper, we reconstruct a phenological series of the first blooming date of Amygdalus davidiana (FBA) in Beijing from A.D. 1741 to 2000. In these series, phenological records after 1950 are all observational data, and before that are reconstructed data based on the records from diaries, poems and other historical documents. In China, poems and diaries are used as important sources of proxy data for reconstructing historical phenological series (Ge et al. 2008) because many phenological phenomena had been recorded in detail in these historical documents (Chuine et al. 2004; Zhang et al. 2013; Liu et al. 2016). … Based on the average of the FBA series, the original FBA series could be divided into 1 later blooming periods of A.D. 1796–1985 and 2 earlier blooming periods of A.D. 1741–1795 and A.D. 1985–2000. … Approximately 85% of the extreme delays followed the large volcanic eruptions (VEI ≥ 4), as the same proportion of the extreme delays followed El Niño events. About 73% of the extreme delays fall in the valleys of sunspot cycles or the Dalton minimum period in the year or the previous year.”
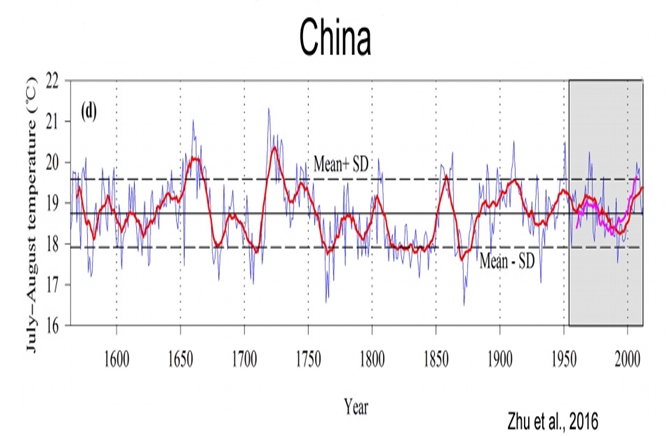
A. No Obvious Net Warming During The Last Few Centuries In Regional China
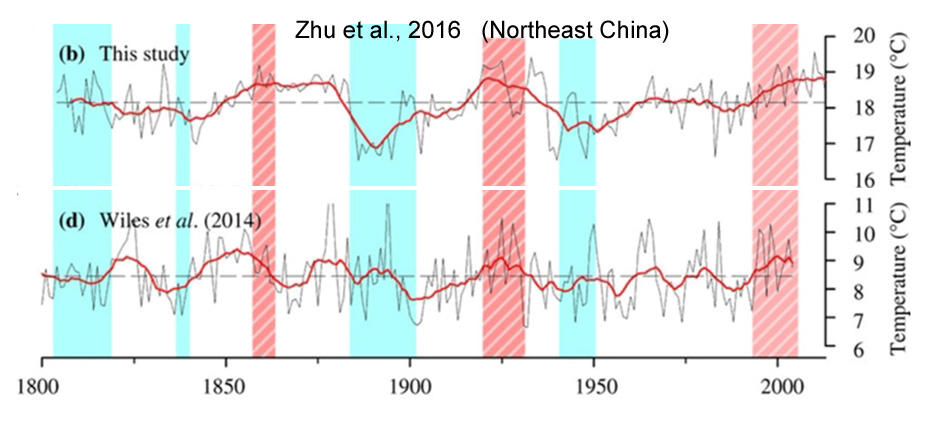
Zhu et al., 2016
“[W]e should point out that the rapid warming during the 20th century was not especially obvious in our reconstructed RLST [surface temperatures, northwestern Sichuan Plateau (NWSP), China].”
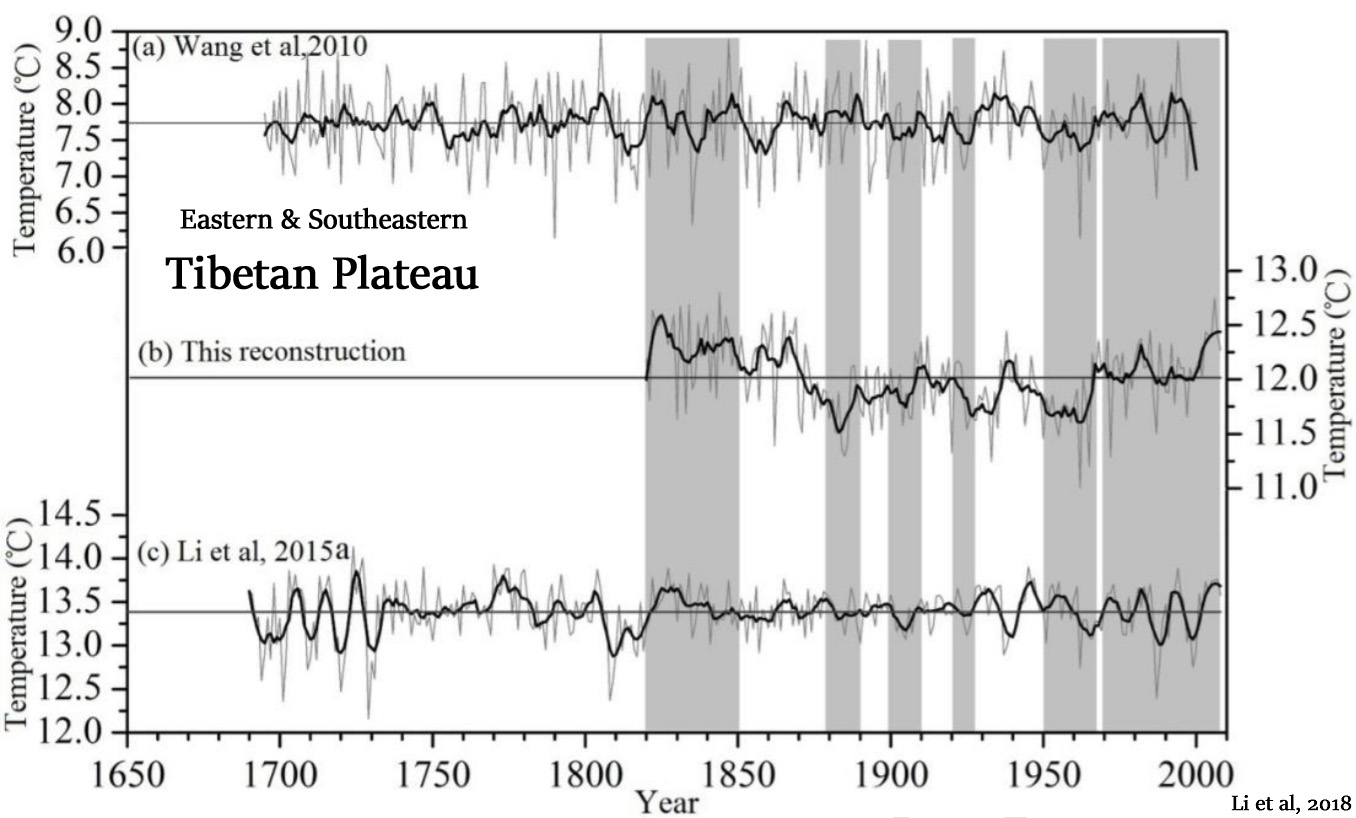
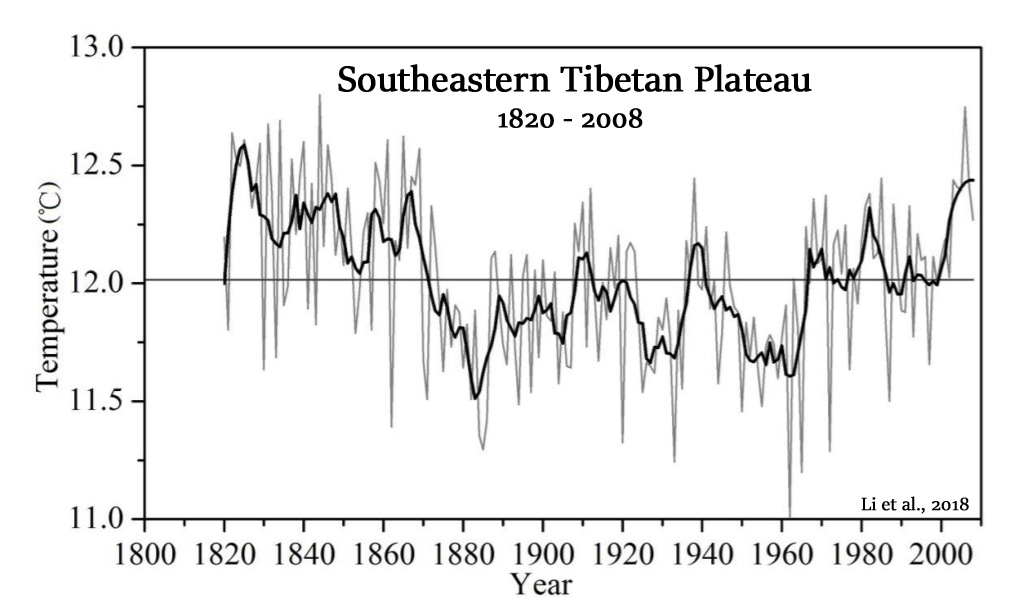
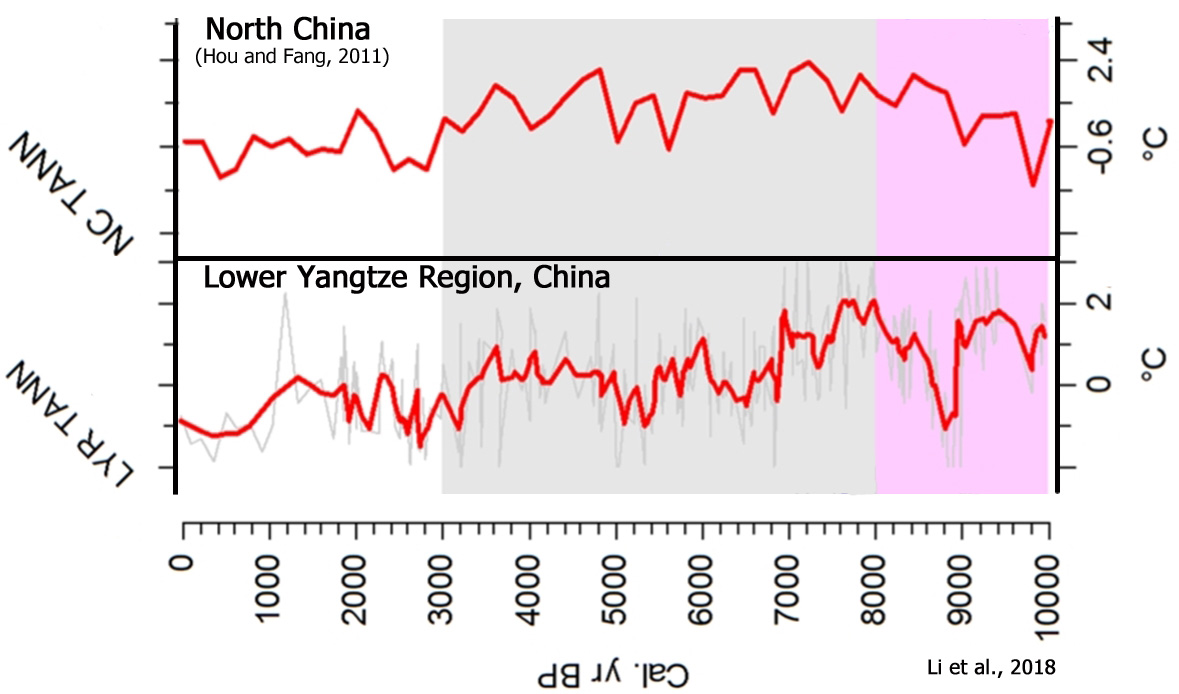
Li et al., 2018
“There are also other studies that suggest that the recent climate warming over the southeastern TP actually began in the 1820s (Shi et al., 2015). However, a few reconstructions from the west and northwest parts of Sichuan or from the southeastern TP indicate thatthere were no obvious increase of temperature during the past decades (Li et al., 2015b; Zhu et al., 2016).”
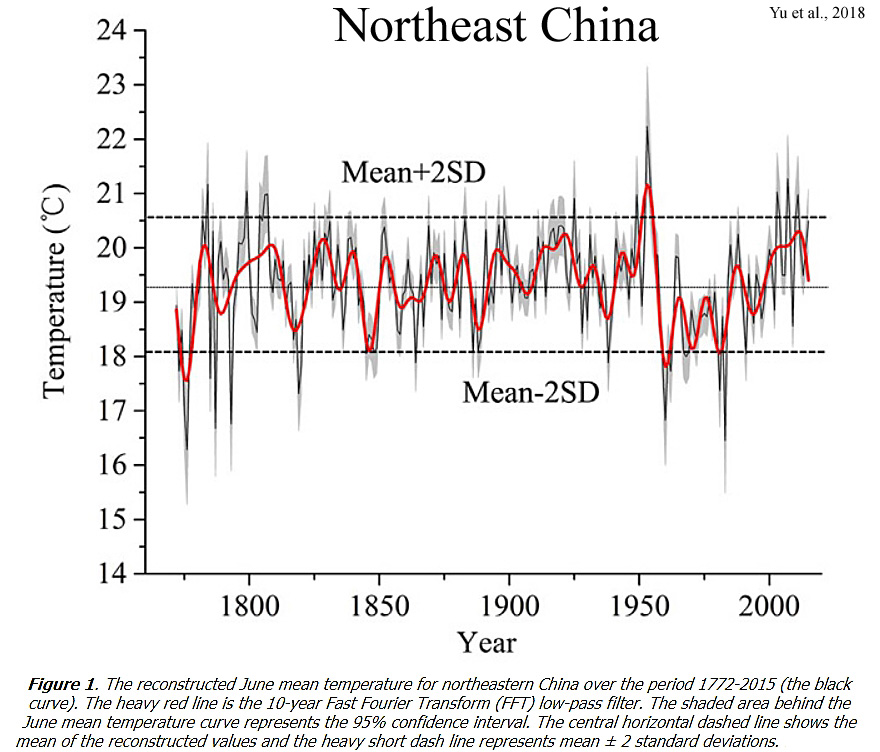
Yu et al., 2018
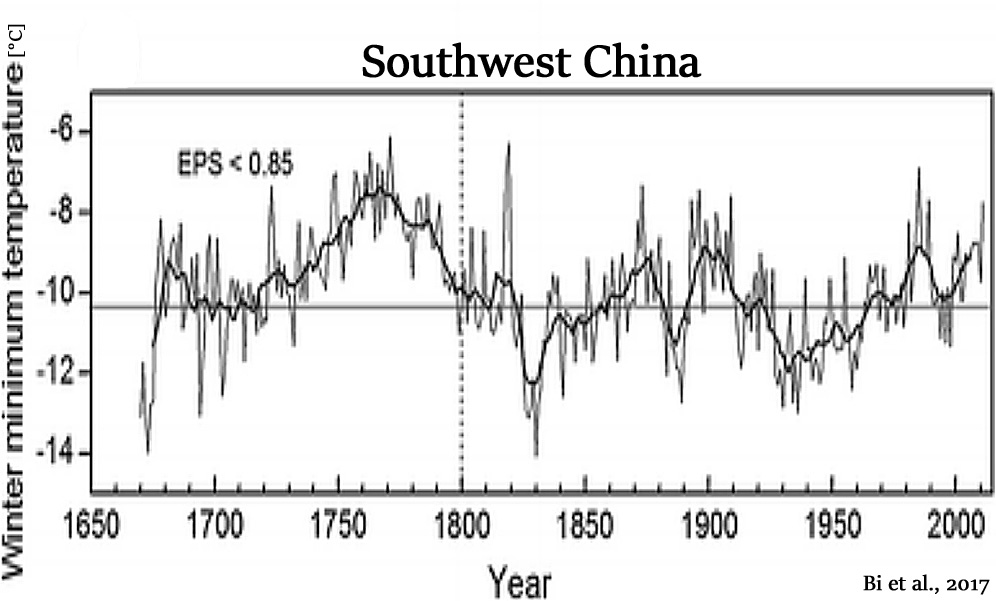
Bi et al., 2017
“[T]he MWT [minimum winter temperature] values and rate of warming over the past seven decades did not exceed those found in the reconstructed temperature data for the past 211 years. … Larger scale climate oscillations of the Western Pacific and Northern Indian Ocean as well as the North Atlantic Oscillation probably influenced the region’s temperature in the past.”
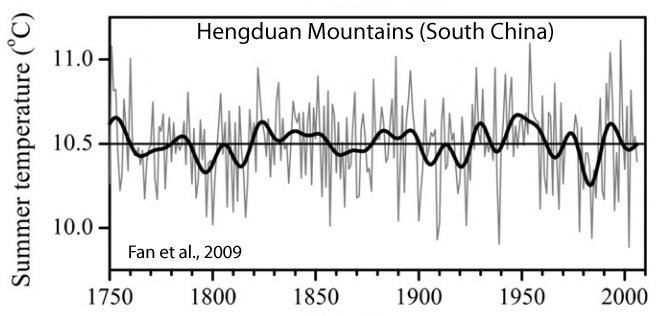
Fan et al., 2009
Zhu et al., 2016
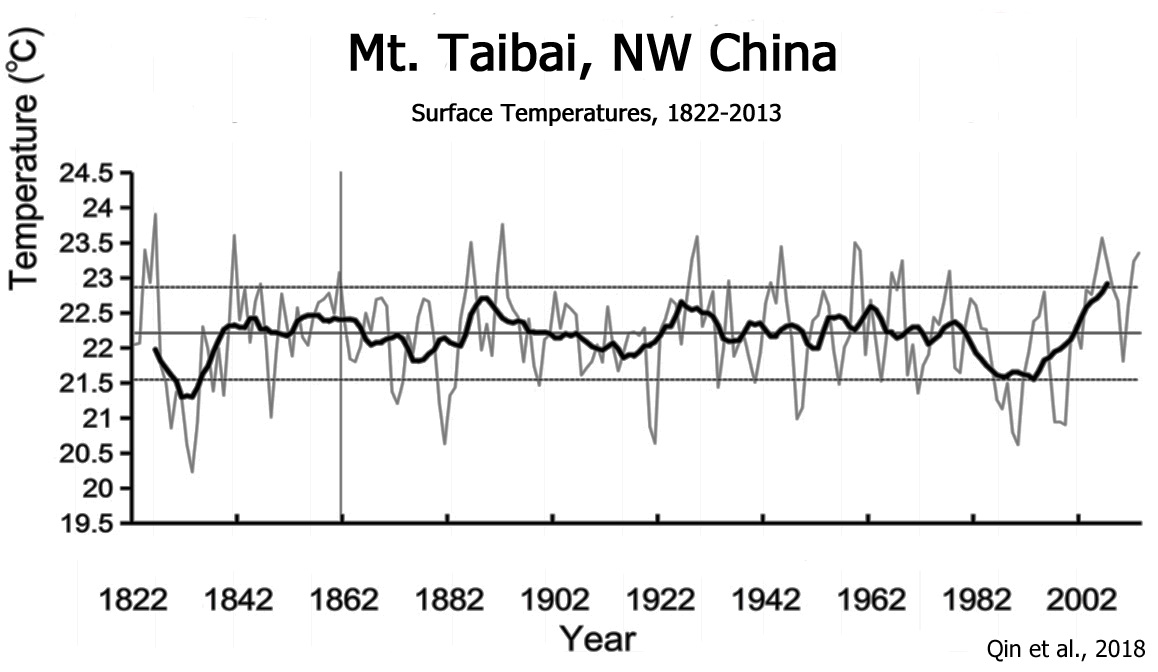
Qin et al., 2018
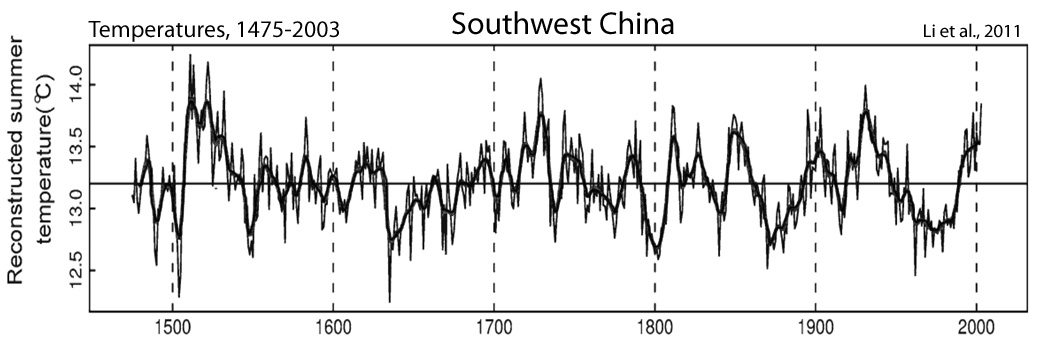
Li et al., 2011
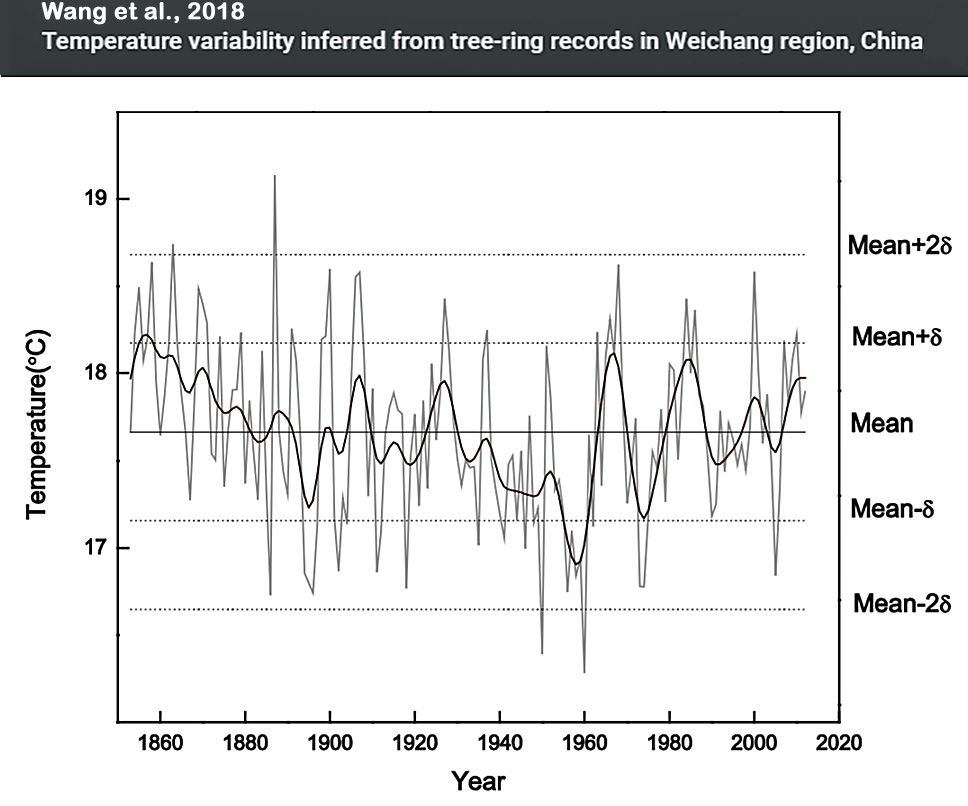
Wang et al., 2018
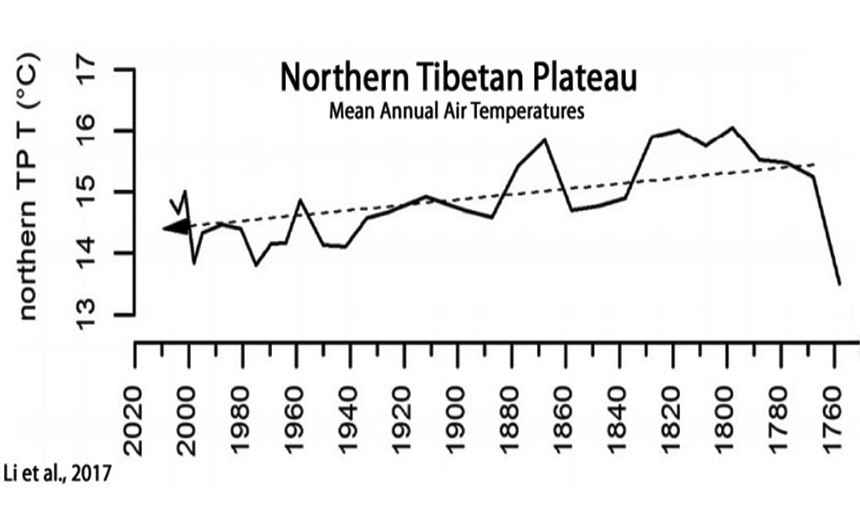
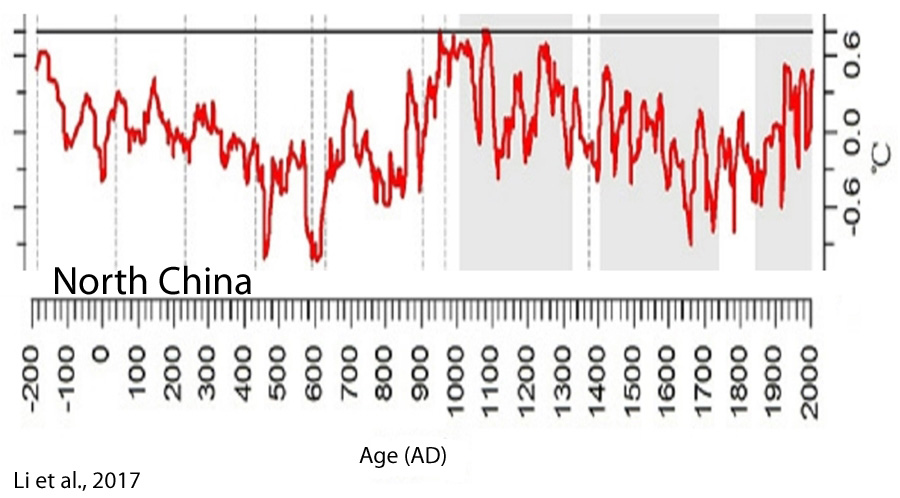
Li et al., 2017
“Contrary to the often-documented warming trend over the past few centuries, but consistent with temperature record from the northern Tibetan Plateau, our data show a gradual decreasing trend of 0.3 °C in mean annual air temperature from 1750 to 1970 CE.”
B. No Obvious Net Warming During The Last Several Decades In Regional China
Lei et al.,2018 (N, NE, SE China)
“The authors analyzed the observed winter surface air temperature in eastern mainland China during the recent global warming hiatus period through 1998-2013. The results suggest a substantial cooling trend of about -1.0°/decade in Eastern China, Northeast China and Southeast China.”
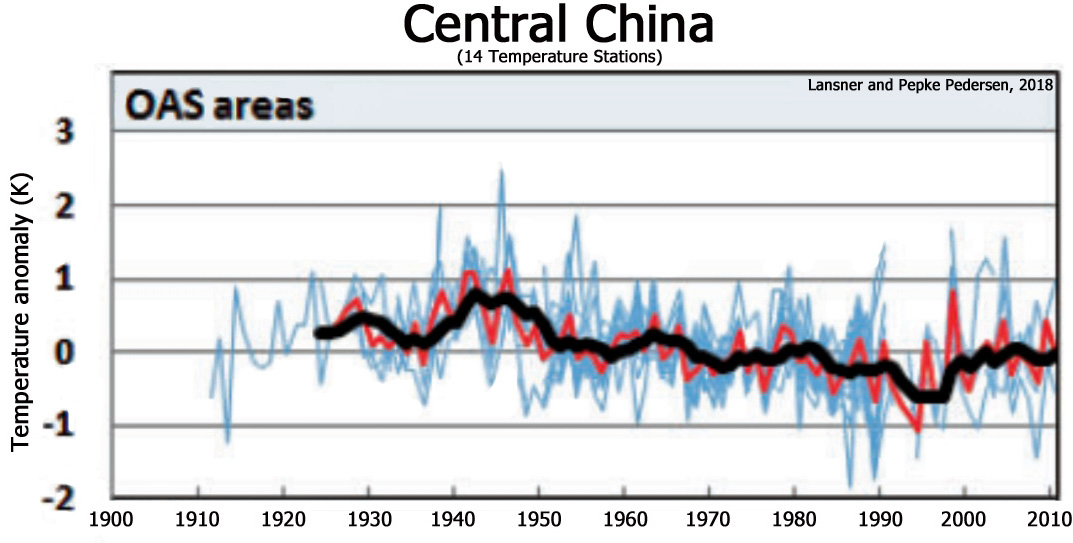
Lansner and Pepke Pedersen, 2018
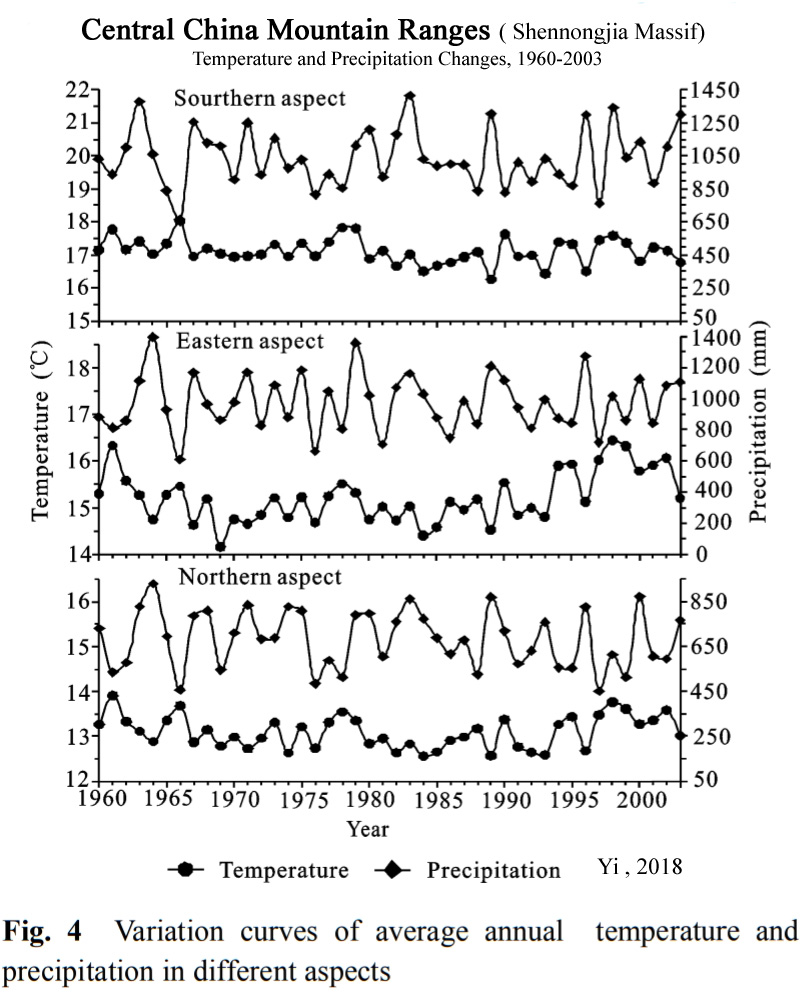
Yi, 2018
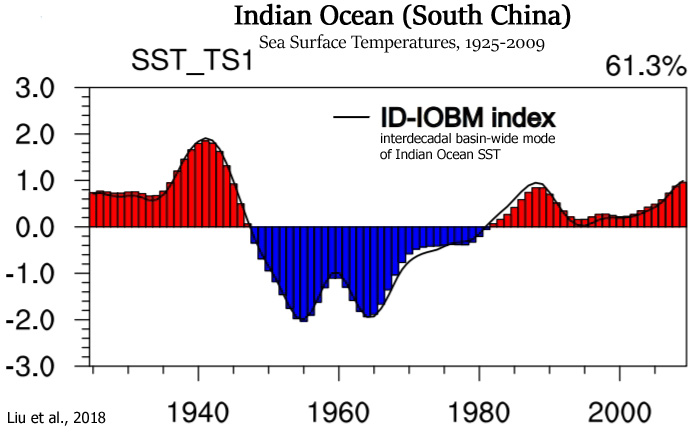
Liu et al., 2018
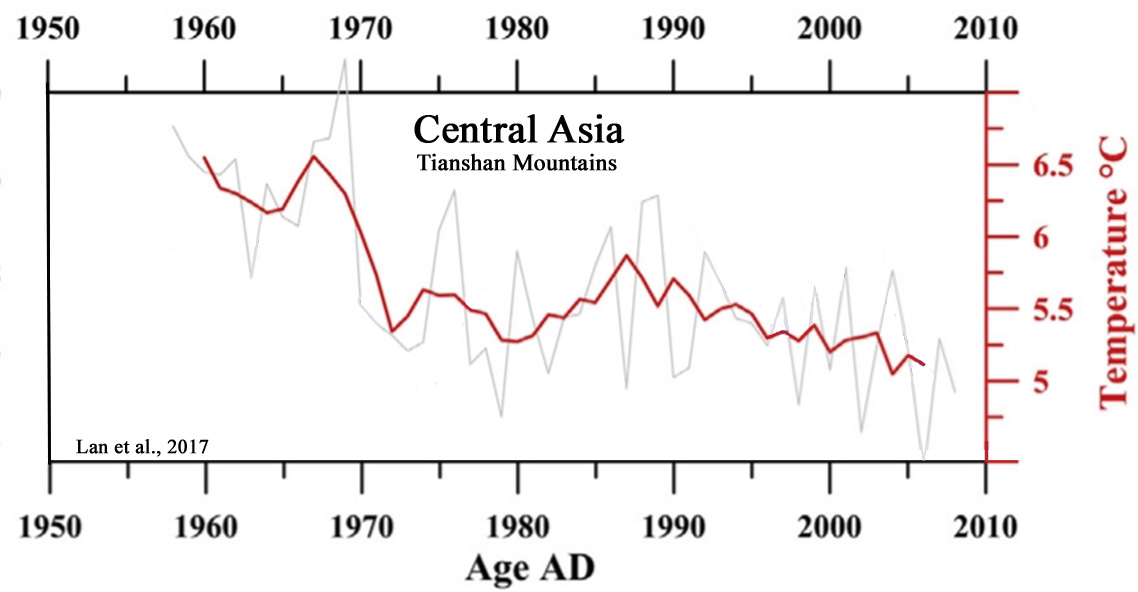
Lan et al., 2017
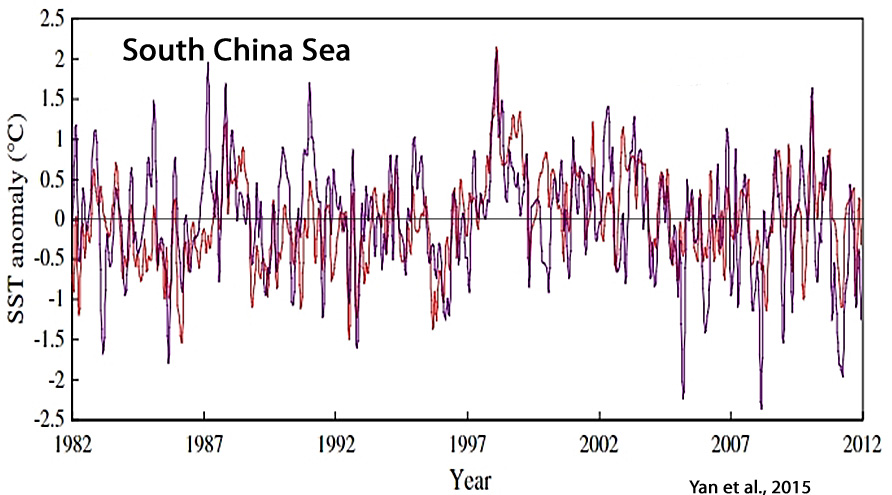
Yan et al., 2015
C. Regional China Temperatures 2 – 7°C Warmer Than Today During Past Millennia
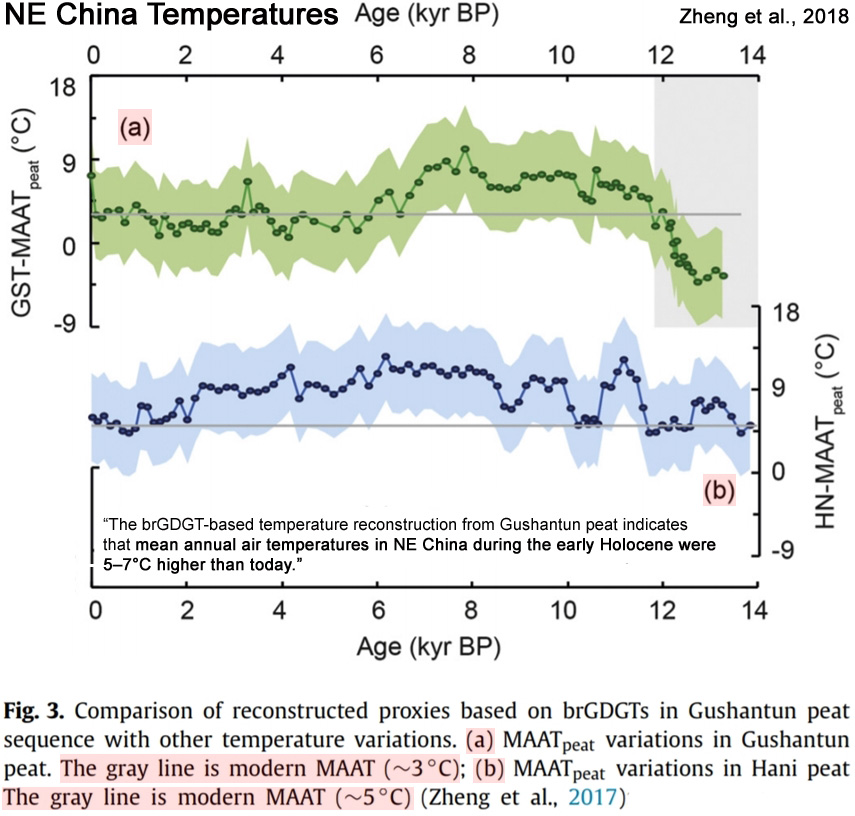
Zheng et al., 2018
“In this study we present a detailed GDGT data set covering the last 13,000 years from a peat sequence in the Changbai Mountain in NE China. The brGDGT-based temperature reconstruction from Gushantun peat indicates that mean annual air temperatures in NE China during the early Holocene were 5–7°C higher than today. Furthermore, MAAT records from the Chinese Loess Plateau also suggested temperature maxima 7–9°C higher than modern during the early Holocene (Peterse et al., 2014; Gao et al., 2012; Jia et al., 2013). Consequently, we consider the temperatures obtained using the global peat calibration to be representative of climate in (NE) China. … The highest temperatures occurred between ca. 8 and 6.8 kyr BP, with occasional annual mean temperatures >8.0 ± 4.7°C, compared to the modern-day MAAT of ∼3°C.”
Li et al., 2009
“The highest temperature was 22.7°C which was recorded at 1.01 cal ka BP. … Cooling period from 0.85 cal. ka BP to present. SST declined obviously in this period, with the maximum decrease amplitude of 2℃. … No global climate warming due to the greenhouse effect since the Industrial Revolution occurs in the study area.”
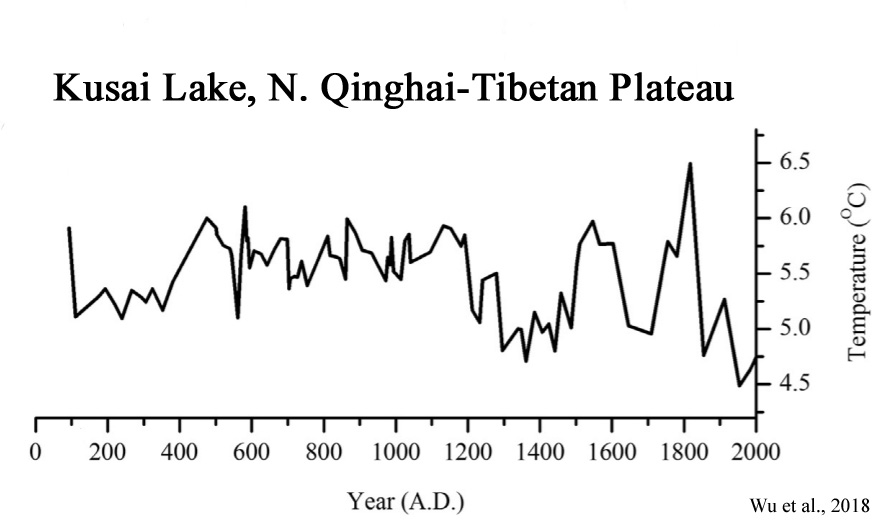
Wu et al., 2018
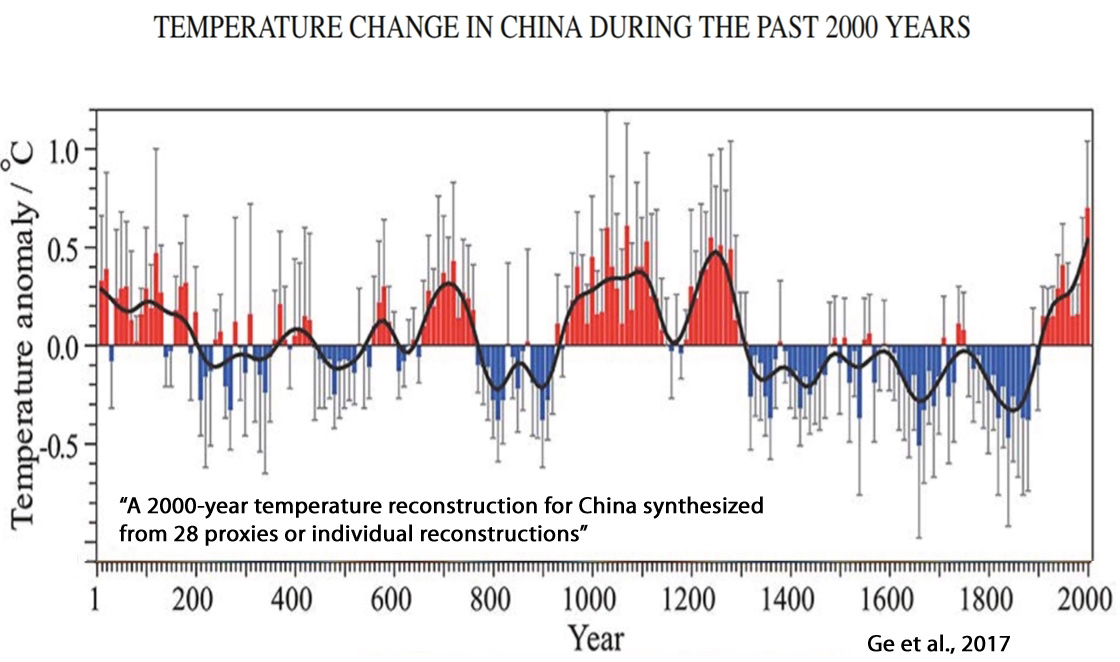
Ge et al., 2017
“This paper presents new high-resolution proxies and paleoclimatic reconstructions for studying climate changes in China for the past 2000 years. Multi-proxy synthesized reconstructions show that temperature variation in China has exhibited significant 50–70-yr, 100–120-yr, and 200–250-yr cycles. Results also show that the amplitudes of decadal and centennial temperature variation were 1.3◦C and 0.7◦C, respectively, with the latter significantly correlated with long-term changes in solar radiation, especially cold periods, which correspond approximately to sunspot minima. The most rapid warming in China occurred over AD 1870–2000, at a rate of 0.56◦ ± 0.42◦C (100 yr)−1; however, temperatures recorded in the 20th century may not be unprecedented for the last 2000 years, as data show records for the periods AD 981–1100 and AD 1201–70 are comparable to the present.”
Deng et al., 2017
“The results indicate that the climate of the Medieval Climate Anomaly (MCA, AD 900–1300) was similar to that of the Current Warm Period (CWP, AD 1850–present).”

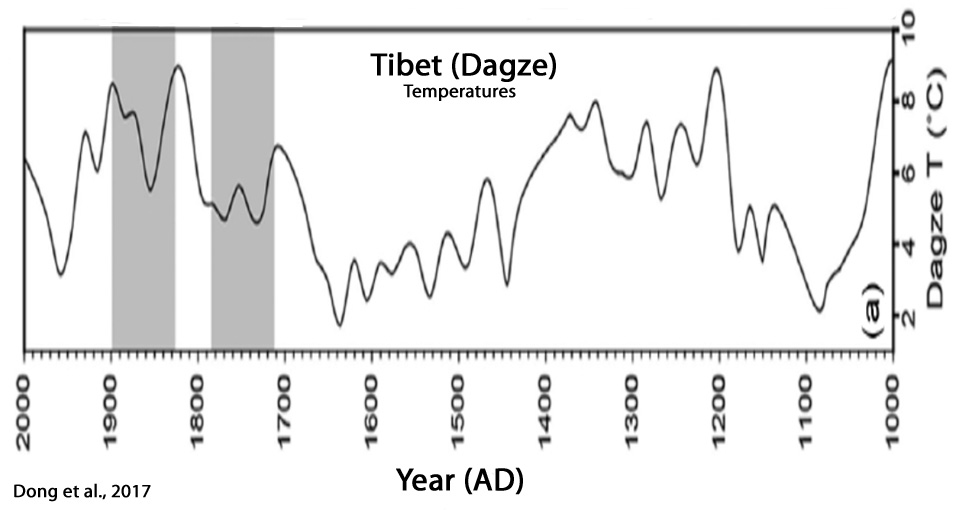
Dong et al., 2017
Li et al., 2017
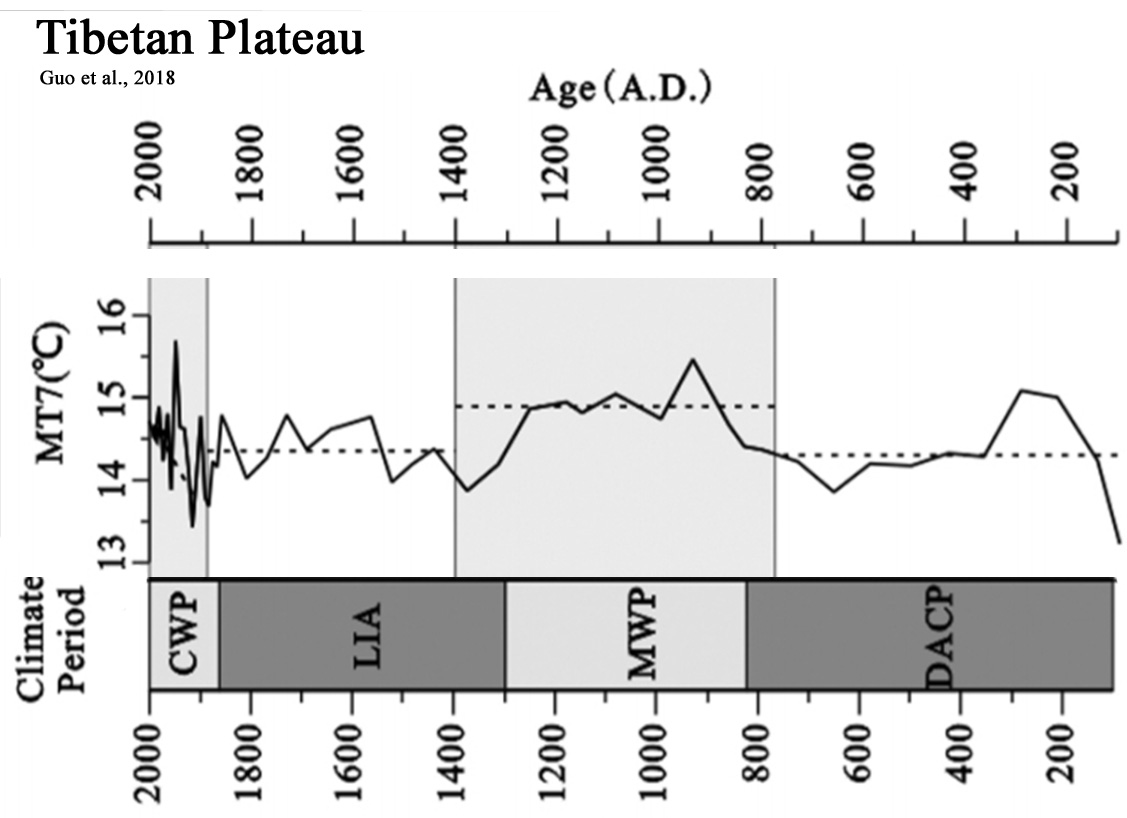
Guo et al., 2018
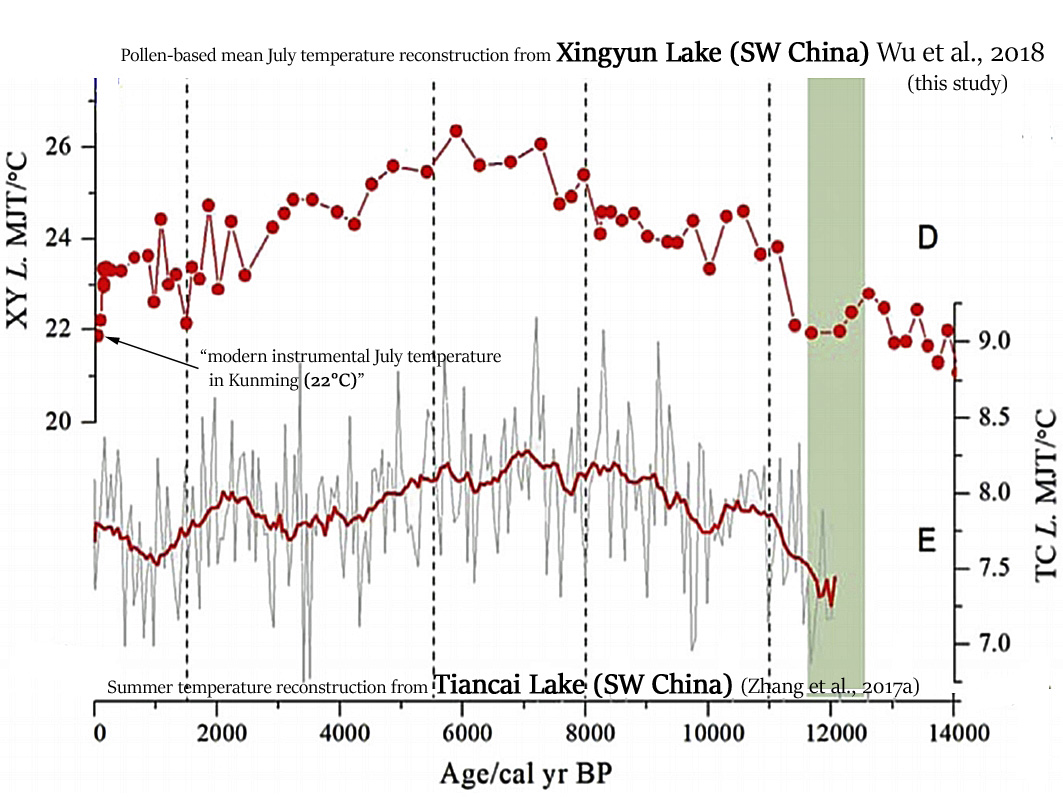
Wu et al., 2018
“Summer temperatures (MJT) at Xingyun Lake in the late glacial were low, increased during the early Holocene, were highest during the middle Holocene, and then decreased during the late Holocene. The range of inferred values [for the Holocene] was 21.0°- 26.5°C. The pollen inferred temperature derived from surface samples (21.2°C), is close to the modern instrumental July temperature in Kunming (22°C), supporting the reliability of reconstructions from down-core pollen assemblages.” [Modern temperatures are 1.0°C above the coldest of the last 14,000 years, and 4.5°C cooler than the warmest temperatures of the last 14,000 years.]
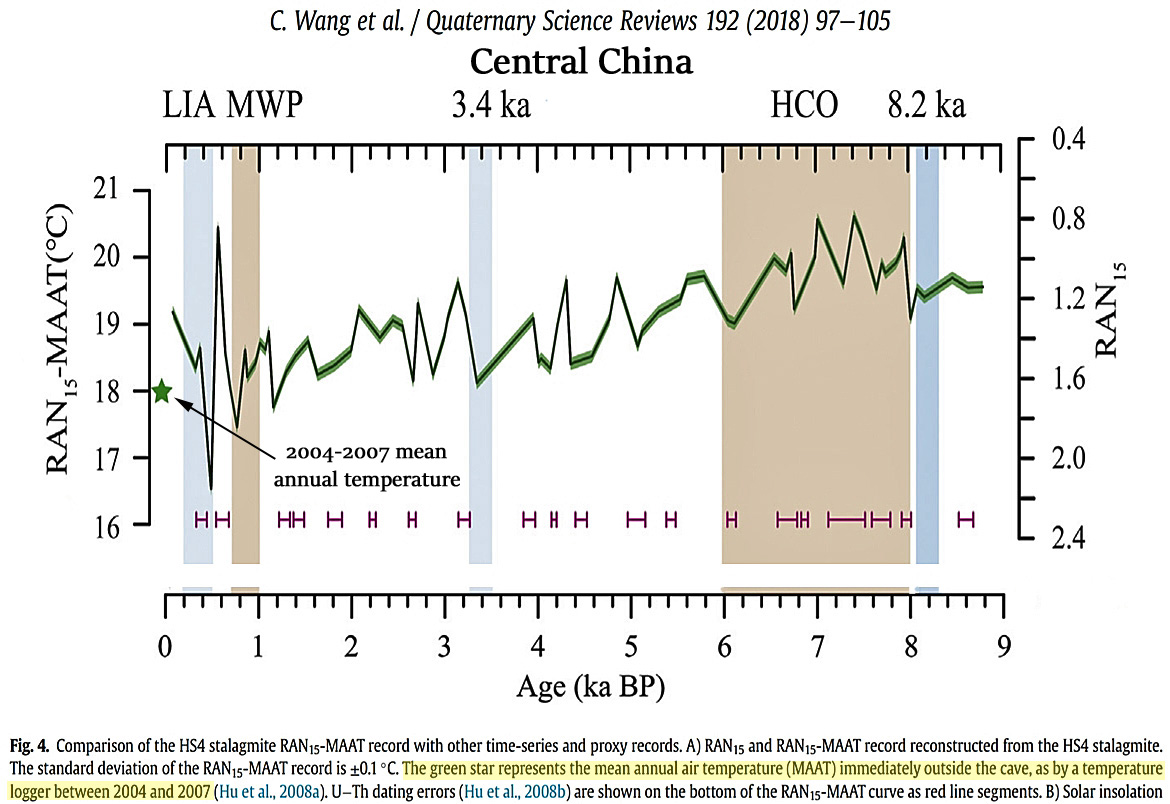
Wang et al., 2018
“The average RAN15-MAAT of 18.4°C over the most recent part of the record (<0.8 ka BP) [the last 800 years BP] overlaps with the range of MAATs, ca. 16.2°C to 18.7°C (av. 17.5°C) measured since 1952 at the nearest meteorological station (Yichang, located ca. 100 km away) and is very close to the av. MAAT of 18°C measured directly outside the cave by a temperature logger between 2004 and 2007 (Hu et al., 2008a). This agreement between reconstructed temperatures and instrumental measurements increases our confidence in the potential of the RAN15 proxy. RAN15-MAATs in HS4 vary from 16.5°C to 20.6°C (av. 19°C), during the last 9 ka BP, and broadly follow a long-term trend of declining temperatures in line with declining solar insolation at 30°N in July (Laskar et al., 2004) (Fig. 4B). The temperature variation (4.1°C) in our record is larger than the calibration error of the RAN15 proxy (RMSE ¼ 2.6°C; Wang et al., 2016). … The Holocene Climate Optimum (HCO) shown in the RAN15-MAAT record is from 8 to 6 ka BP, with the highest temperature at ca. 7.0 ka BP. Superimposed on the orbital-scale Holocene trend are centennial to millennial scale climate fluctuations of ca. 1-2°C. Interestingly, the most recent 0.9 ka BP [900 years BP] is distinguished by greater variability with the highest (20.5°C) and lowest (16.5°C) RAN15-MAATs occurring consecutively at 0.6 ka BP [600 years BP] and 0.5 ka BP [500 years BP].” [Surface temperatures dropped by -4.0°C within ~100 years.]
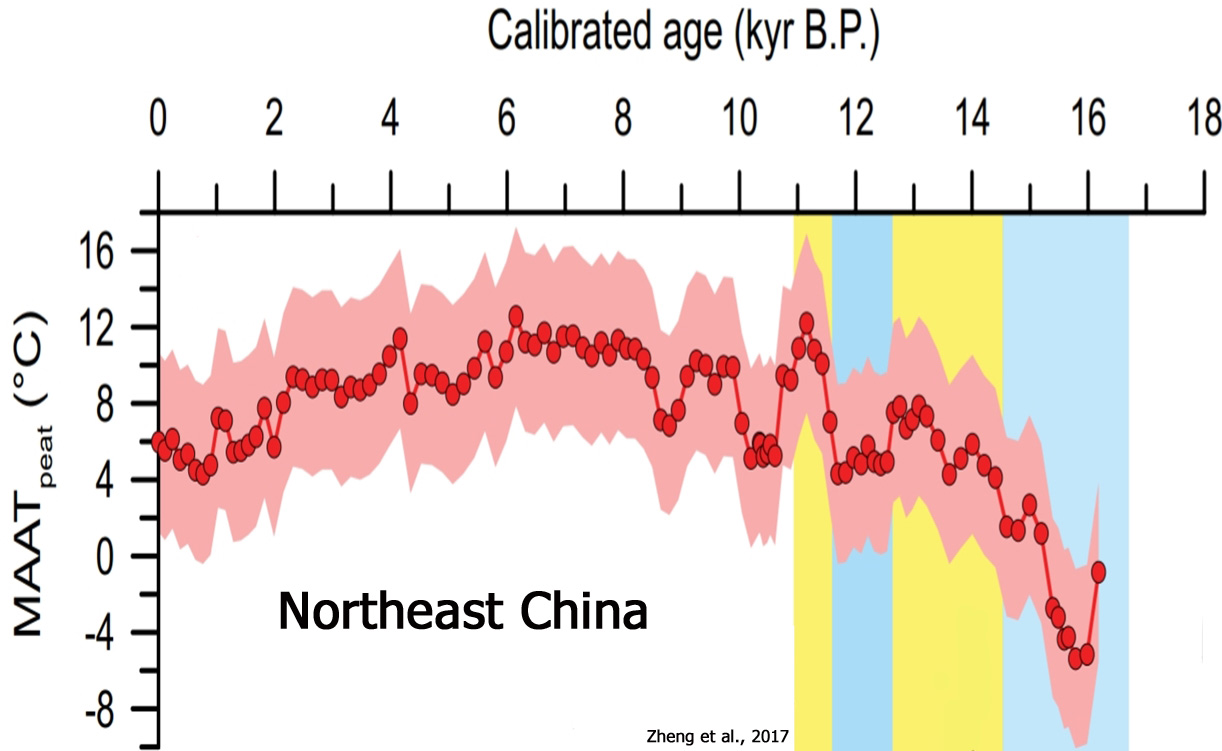
Zheng et al., 2017
“From 11.5 to 10.7 ka [11,500 to 10,700 years ago], corresponding to the Preboreal event, MAATpeat indicates even higher [temperature] values, from 7.0 to 12 °C. MAATpeat continued to vary during the Holocene. From 10.7 to 6.0 ka, temperatures rose stepwise, with 2 cool events at 10.6–10.2 and 8.6 ka, beforereaching maximum values of ~11 °C during the early Holocene from 8.0 to 6.0 ka. Following the early Holocene, temperatures at Hani gradually decreased to values of ~5 °C, close to the observed temperature at Hani across the past 60 yr (4–7.5 °C).” [Modern temperatures are about 5-6°C colder than 6,000 to 8,000 years ago.]
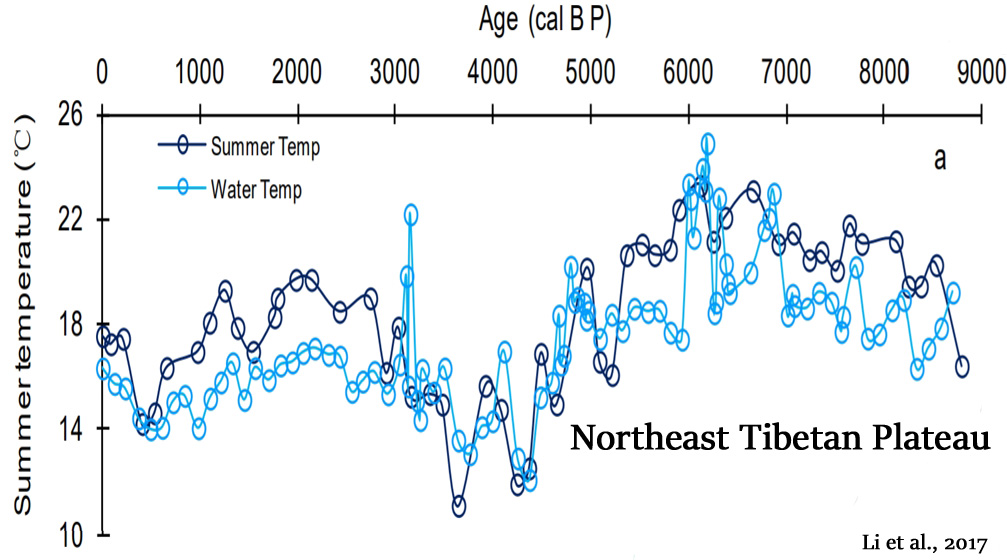
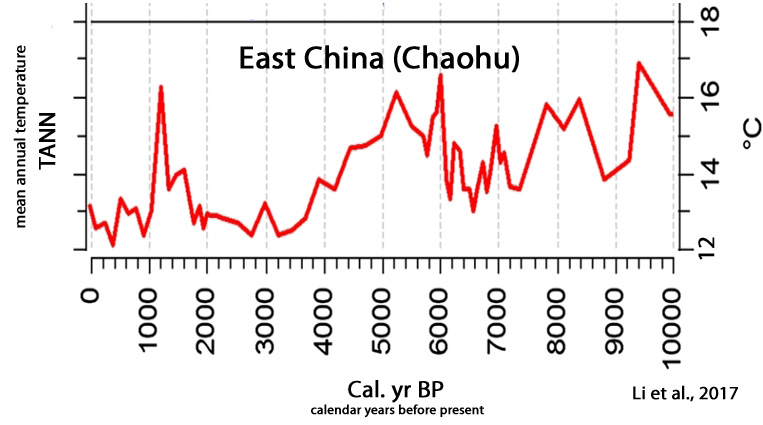
Li et al., 2017
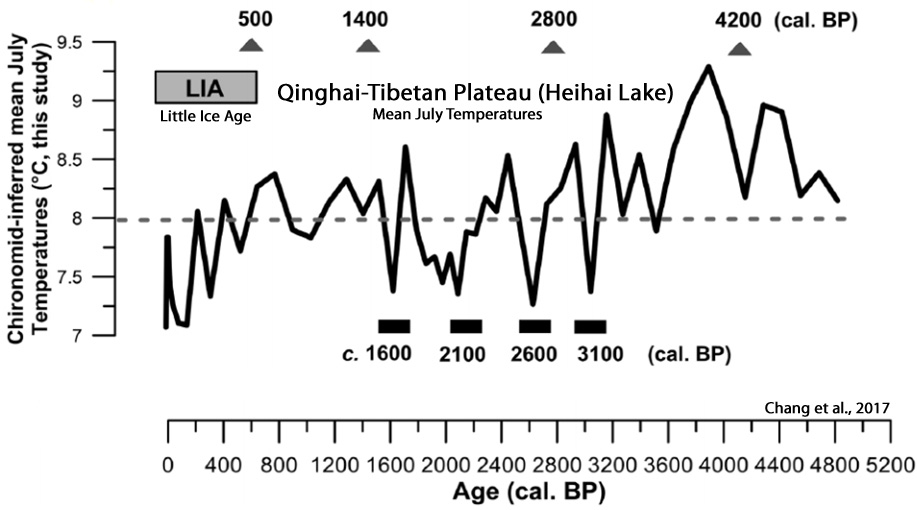
Chang et al., 2017
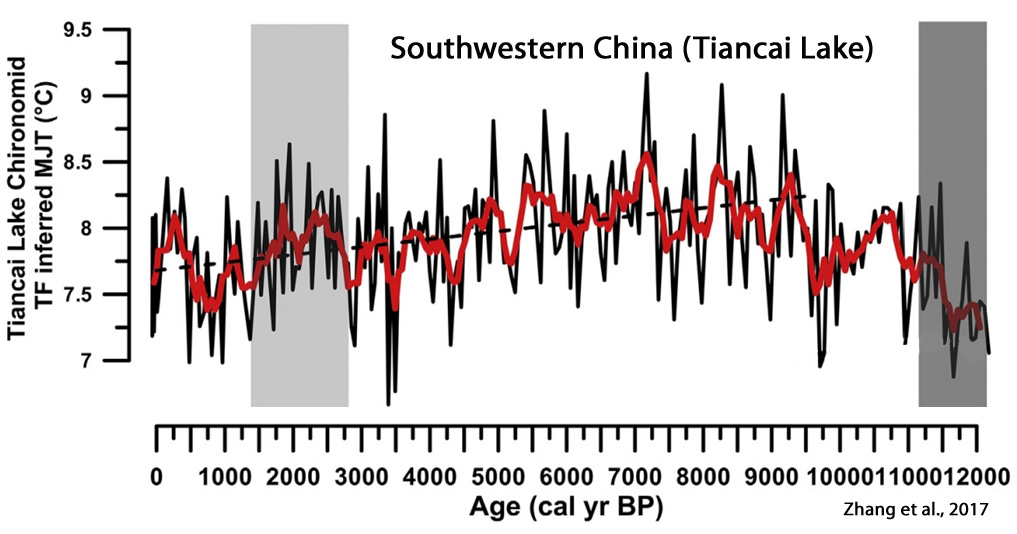
Zhang et al., 2017
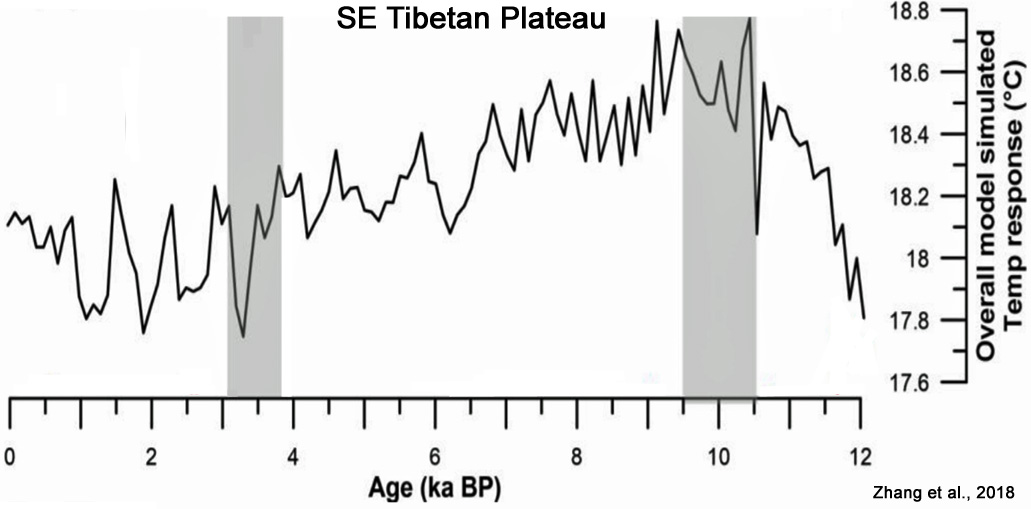
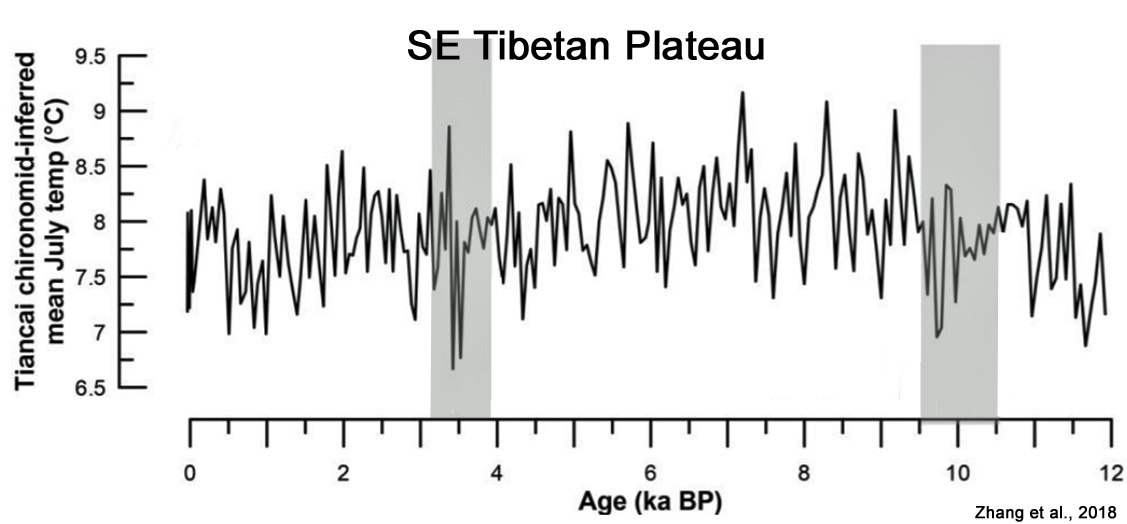
Zhang et al., 2018
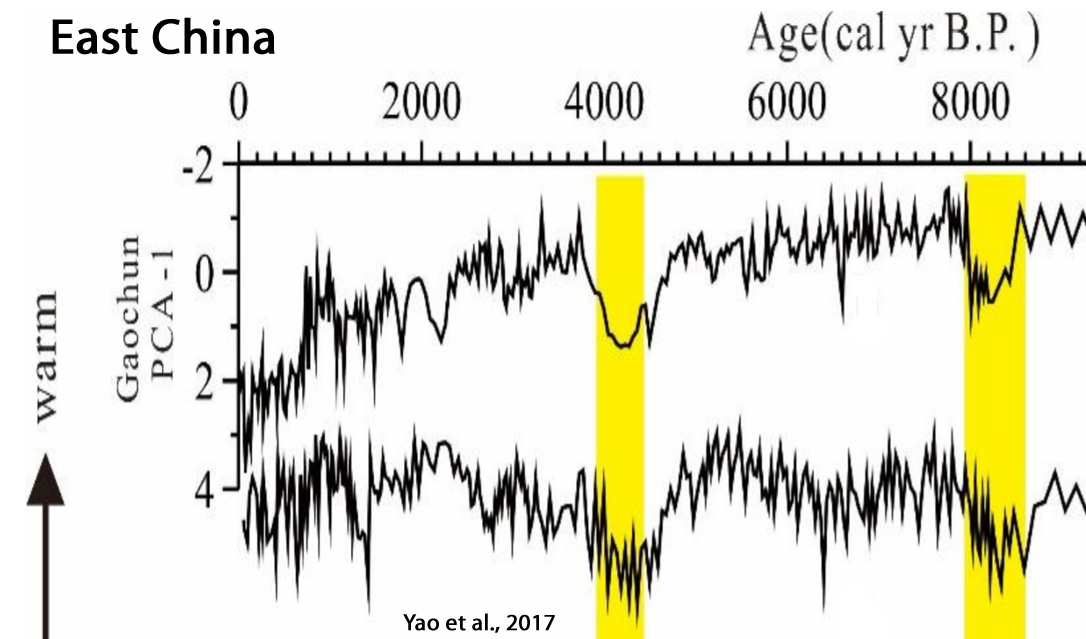
Yao et al., 2017
Sun et al., 2017

Li et al., 2017
Li et al., 2017

Li et al, 2018
Wang et al., 2017