
Schneefan at German weather and climate analysis site wobleibtdieerderwaermung.de here brings us the latest on atmospheric temperatures.
First we note that the middle troposphere (7,500 meters) as measured by NASA has seen recently a sharp cooling off since the start of April:

The chart shows the daily mean temperature at about 7,500 meters altitude, i.e. middle troposphere (400 mb/hPa). Here we see that temperatures have dived (pink curve) and reached a near 17-year low for this time of the year. Source: https://ghrc.nsstc.nasa.gov/amsutemps/
An enlargement shows a comparison to last year, last updated April 9, 2018.

Temperature at 7,500 m altitude have dived steeply since early April. Source: https://ghrc.nsstc.nasa.gov/amsutemps/
Near surface temperatures sharply down
Also the global 2m surface temperature is showing a strong downward trend:

The plotted data have already been adjusted (falsified?) with the NASA/GISS factor, and so may actually be even lower. Source: http://www.karstenhaustein.com/climate.php
Should the cold temperatures persist, April, 2018, could fall below the zero anomaly for the first time since 2012, foremost with the UAH satellite data. The following UAH chart shows lower tropospheric temperatures (1500) continuing their decline after the warm peak caused by the natural El Niño phenomenon:

Source: UAH Global Temperature Update for March, 2018: +0.24 deg. C
In March, 2018, lower tropospheric temperatures (1500m) over the oceans (71% of the earth’s surface) also saw a further drop:
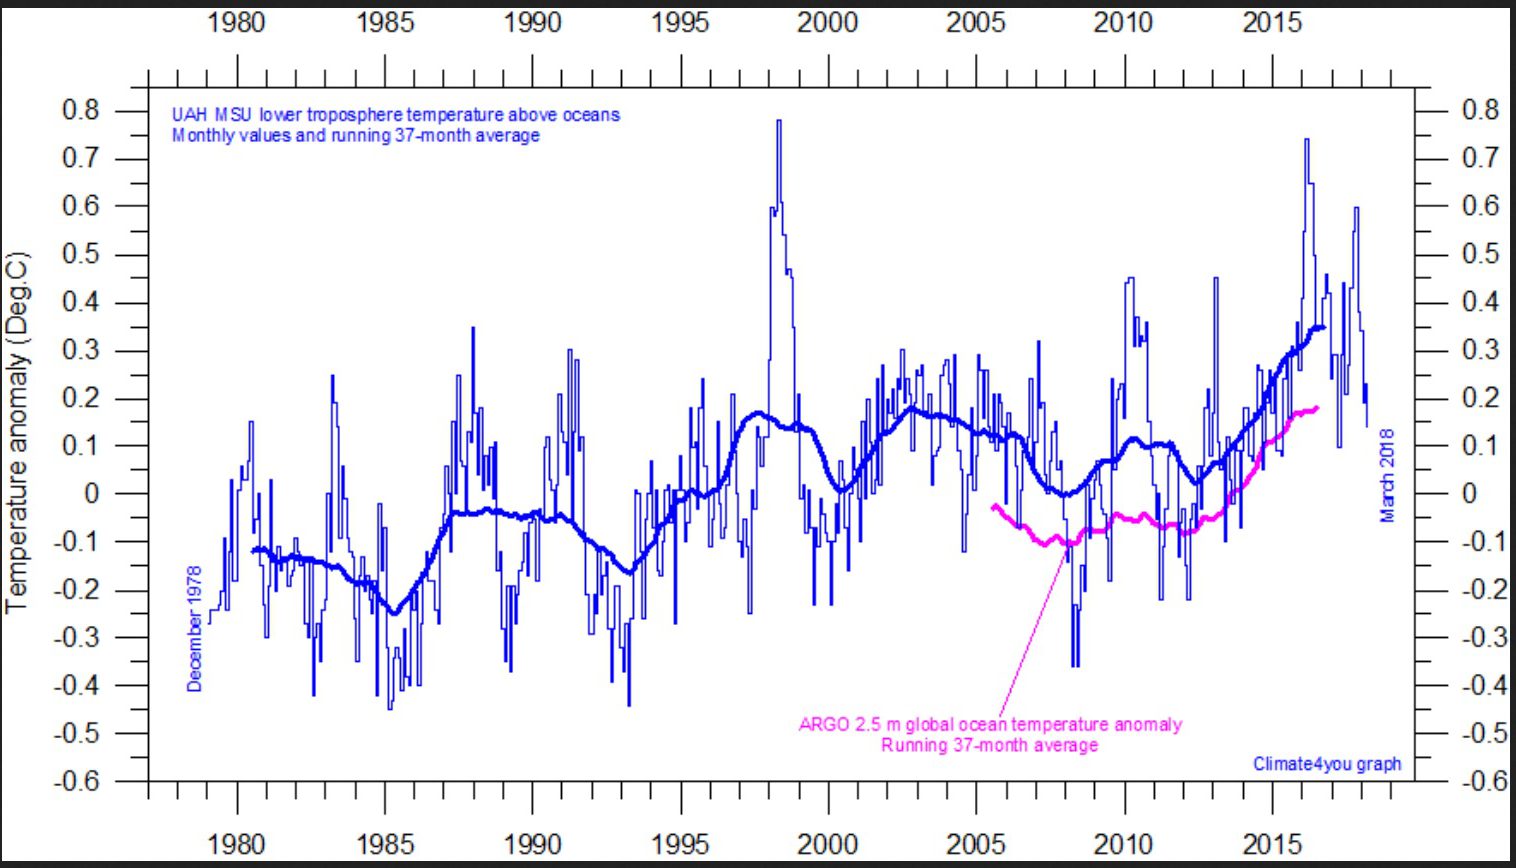
Source: climate4you.
More cooling over the coming months
The following chart shows the El Niño Southern Oscillation (ENSO) 3.4 plot, i.e. the ocean surface temperature anomaly of the western equatorial Pacific region, since July 2016.

Source: climexp.knmi.nl/start.cgi
Much of the last 2 years has been in the globe-cooling La Niña phase (blue). And as satellite instrument temperatures tend to lag the El Niño temperature anomalies by some 4 months, further surface cooling is expected to show up in the satellite data over the coming months.
ENSO indicates more cooling ahead
The Southern Oscillation Index (SOI) is an indicator for the development of the easterly trade winds at the equatorial Pacific and thus tells us what’s ahead for the ENSO. Recall that the ENSO has a powerful impact on global surface temperatures. SOI values over +7.0 indicates La Niña conditions 2 months ahead, while an SOI under -7.0 points El Niño conditions.
Currently the following chart shows the SOI is at +13.7, which means the globe-cooling La Niña should continue on two months from now, and thus means cooler satellite measurements showing up 6 months later.

The Southern Oscillation Index (SOI) is currently at +13,7, thus pointing to La Niña conditions 2 months from now. Source: www.bom.gov.au/climate/enso/
Recently some scientists have postulated that the ENSO is impacted by solar activity, which currently is at a low (earth-cooling) level. The next solar cycle is expected to be a weak one, thus boding more cooling and tough winters ahead.
It’s got nothing to do with trace gas CO2.
