20 New Papers Affirm Modern Climate Is In Phase With Natural Variability
Natural Variability Dominates Climate
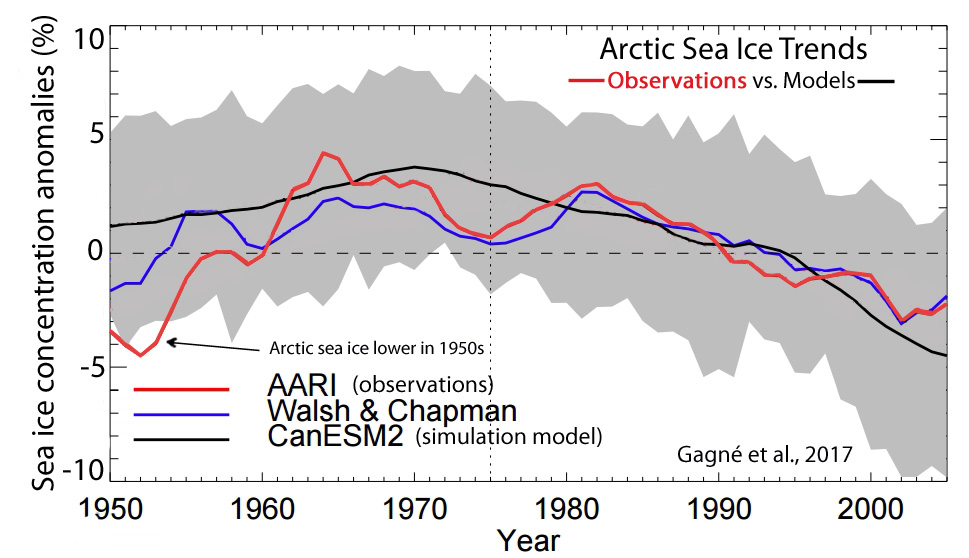
Last week, the newly published Gagné et al. (2017) paper received some attention because the authors pointed out that Arctic sea ice grew substantially between 1950 and 1975, consistent with the in-phase cooling trend during that period.
Gagné et al., 2017 “Updated observational datasets without climatological infilling show that there was an increase in sea ice concentration in the Eastern Arctic between 1950 and 1975, contrary to earlier climatology in-filled observational datasets that show weak inter-annual variations during that time period.”
The AARI [Arctic and Antarctic Research Institute] and Walsh & Chapman sea ice data sets used in the paper (see graph above) included exclusively observational evidence — “climatological infilling were not included … we only used observed data”. Both observational data sets indicated that Arctic sea ice concentration anomalies were as low or lower in the early 1950s than they have been during recent decades.
During the early 1950s, CO2 concentrations hovered between 310 and 315 ppm. Today, atmospheric CO2 has reached 400 ppm. And yet early 1950s sea ice extent was similar to or lower than today. This would imply that the Arctic sea ice recession observed in recent decades is well within the range of natural variability, or within the range of what has occurred without human interference or high rates of anthropogenic CO2 emissions.
In the recently published scientific literature, distinguishing between a presumably human-caused influence on climatic trends and natural or internal variability (or “noise”) has not only become more and more difficult, scientists are increasingly pointing out that an anthropogenic signal in climate trends “has yet to be detected above the level of natural climate variability.”
In addition to the more than 20 new scientific papers affirming a robust connection between solar forcing and climate already published in 2017, there are another new 20 scientific papers that indicate natural variability and/or natural oceanic/atmospheric oscillations (ENSO, NAO, PDO) dominate as modulators of precipitation, temperature/climate, and sea level/flooding.
Natural Variability, Ocean Cycles Dominate And Modulate Precipitation Patterns
1. Lachniet et al., 2017 “[M]onsoon dynamics appear to be linked to low-frequency variability in the ENSO and NAO, suggesting that ocean-atmosphere processes in the tropical oceans drive rainfall in Mesoamerica. … Climate model output suggests decreasing rainfall as a consequence of anthropogenic greenhouse gas radiative forcing (Rauscher et al., 2008; Saenz-Romero et al., 2010). Our data show, however, that the response of the monsoon will be strongly modulated by the changes in ENSO and the NAO mean states … Our data also show that the magnitude of Mesoamerican monsoon variability over the modern era when the anthropogenic radiative forcing has dominated over solar and volcanic forcings (Schmidt et al., 2012) is within the natural bounds of rainfall variations over the past 2250 years. This observation suggests that if anthropogenic forcing has impacted the Mesoamerican monsoon, the signal has yet to be detected above the level of natural climate variability, and the monsoon response to direct radiative forcing and indirect ocean-atmosphere forcings may yet to be fully realized.”
2. Conroy et al., 2017 “20th century precipitation variability in southern Tibet falls within the range of natural variability in the last 4100 yr, and does not show a clear trend of increasing precipitation as projected by models. Instead, it appears that poorly understood multidecadal to centennial internal modes of monsoon variability remained influential throughout the last 4100 yr. … Until we have a predictive understanding of multidecade to multi-century variability in the Asian monsoon system, it would be wise to consider the risk of prolonged periods of anomalously dry and wet monsoon conditions to be substantial (Ault et al., 2014). Such variability may also explain why the predicted anthropogenic increase in Asian monsoon precipitation is not widely observed.”
3. Bianchette et al., 2017 “Seven periods of increased water level, varying in duration, occurred during the backbarrier period, with El Niño-Southern Oscillation (ENSO) likely the main climatic mechanism causing these periodic shifts in the paleo-precipitation levels. We suggest that the deepest water levels detected over the last ~3200 years correlate with periods of increased ENSO activity.”
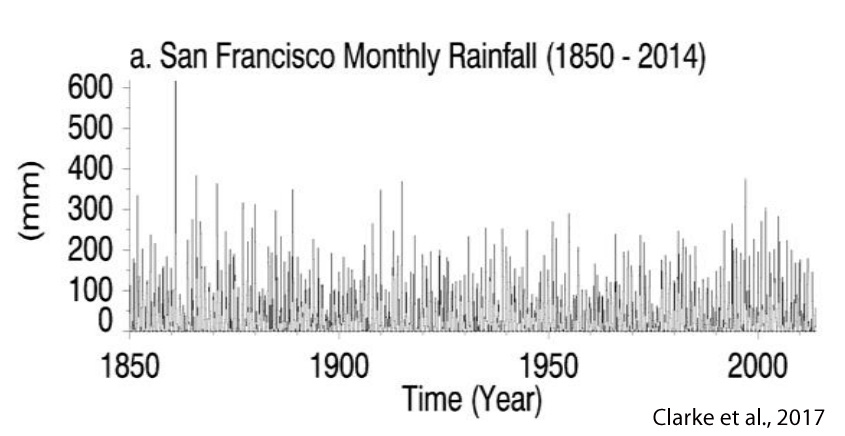
4. Clarke et al., 2017 “Corresponding ~4-8 year periodicities identified from Wavelet analysis of particle size data from Pescadero Marsh in Central Coast California and rainfall data from San Francisco reflect established ENSO periodicity, as further evidenced in the Multivariate ENSO Index (MEI), and thus confirms an important ENSO control on both precipitation and barrier regime variability.”
5. Valdés-Pineda et al., 2017 “This study analyzes these low-frequency patterns of precipitation in Chile (>30 years), and their relationship to global Sea Surface Temperatures (SSTs), with special focus on associations with the Pacific Decadal Oscillation (PDO) and the Atlantic Multi-decadal Oscillation (AMO) indices. … We conclude that a significant multi-decadal precipitation cycle between 40 and 60 years is evident at the rain gauges located in the subtropical and extratropical regions of Chile. This low-frequency variability seems to be largely linked to PDO and AMO modulation.”
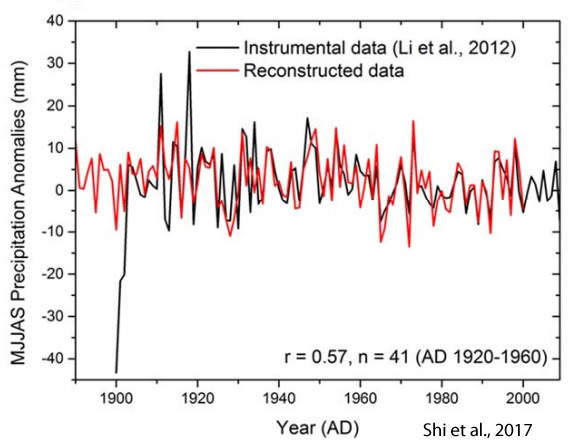
6. Shi et al., 2017 “Five of the six coupled ocean-atmosphere climate models of the Paleoclimate Modeling Intercomparison Project Phase III (PMIP3), can reproduce the south-north dipole mode of precipitation in eastern China, and its likely link with ENSO. However, there is mismatch in terms of their time development. This is consistent with an important role of the internal variability in the precipitation field changes over the past 500 years.”
Natural Variability, Ocean Cycles Dominate And Modulate Temperature, Climate
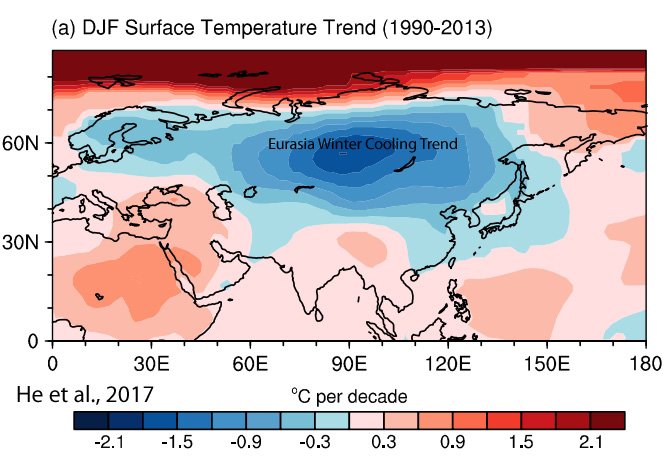
7. He et al., 2017 “As pointed out by Cohen et al. (2014), continental winter SAT [surface temperature] trends since 1990 exhibit cooling over the midlatitudes. The negative trends extend from Europe eastward to East Asia, with a center of maximum magnitude to the west of the Baikal. As reviewed above, the AO/NAO [Arctic Oscillation/North Atlantic Oscillation] shows an in-phase relationship with the SAT [surface temperatures] over Eurasia. … [T]he negative trend in the AO/NAO might explain the recent Eurasian winter cooling. … Additionally, the relationship between the winter AO and surface-climate anomalies in the following spring might be modulated by the 11-year solar cycle (Chen and Zhou, 2012). The spring temperature anomalies in northern China related to the previous winter AO were larger and more robust after high solar cycle winters. However, spring temperature anomalies became very small and insignificant after the low solar cycle winters. … Numerous atmospheric scientists have documented that the AO could impact significantly the climate over Europe and Far East. … It is evident that a positive winter AO causes warmer winters over East Asia through enhancing Polar westerly jet which prevents cold Arctic air from invading low latitudes“
8. Muñoz et al., 2017 “Temperature and humidity display rapid and significant changes over the Holocene. The rapid transition from a cold (mean annual temperature (MAT) 3.5°C lower than today) and wet Younger Dryas to a warm and dry early Holocene is dated at 11,410 cal yr BP. During the Holocene, MAT [mean annual temperature] varied from ca. 2.5°C below to 3.5°C above present-day temperature. Warm periods (11,410, 10,700, 9700, 6900, 4000, 2400 cal yr BP) were separated by colder intervals. The last 2.4 kyr of the record is affected by human impact [on the pollen proxy record]. The Holocene remained dry until 7500 cal yr BP. Then, precipitations increased to reach a maximum between 5000 and 4500 cal yr BP. A rapid decrease occurred until 3500 cal yr BP and the late Holocene was dry. … The highest rainfall intervals correlate with the highest activity of ENSO. Variability in solar output is possibly the main cause for this millennial to decadal cyclicity. We interpret ENSO [El Niño-Southern Oscillation] and ITCZ [Intertropical Convergence Zone] as the main climate change-driving mechanisms in Frontino. … From ca. 8000 cal yr BP, climate in both areas was under the dual influence of ENSO and ITCZ, thereby showing existing teleconnections between the tropical Pacific and Atlantic oceans.”
9. Park et al., 2017 “According to our results, the central Mexican climate has been predominantly controlled by the combined influence of the 20-year Pacific Decadal Oscillation (PDO) and the 70-year Atlantic Multidecadal Oscillation (AMO). However, the AMO probably lost much of its influence in central Mexico in the early 20th century and the PDO has mostly driven climate change since.”
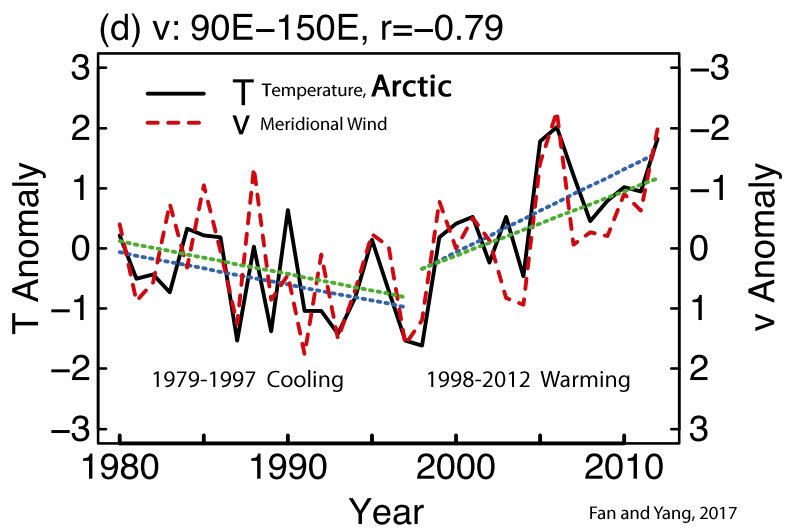
10. Fan and Yang, 2017 “The wintertime Arctic temperature decreased from 1979 to 1997 and increased rapidly from 1998 to 2012, in contrast to the global mean surface air temperature [which] increased between 1979 and 1997, followed by a hiatus … A recent study suggests a possible role of the Pacific Ocean decadal oscillation in regulating wintertime climate in the Arctic (Screen and Francis 2016). … The ‘‘greenhouse effect’’ of water vapor and clouds may amplify the effect of winds on Arctic winter climate. [CO2 not mentioned as contributing to the GHE] … The objectives of this study are to assess how much natural–internal variability has contributed to climate changes in these [Arctic] regions from 1979 to 2012 … In summary, the correlation analyses presented in this paper shows a natural mode of Arctic winter variability resulting from the Nordic–Siberian seesaw of meridional winds […] is associated with two-thirds of the interannual variance of winter-mean Arctic temperature between 1979 and 2012, and possibly contributed a substantial fraction of the observed Arctic amplification [1998-2012 warming] in this period.”
11. Reynolds et al., 2017 “Evidence derived from instrumental observations suggest that Atlantic variability, associated with changes in SSTs and fluctuations in the strength of the Atlantic Meridional Overturning Circulation (AMOC), is directly linked with broader scale climate variability, including Brazilian and Sahel precipitation (Folland et al., 1986 and Folland et al., 2001), Atlantic hurricanes and storm tracks (Goldenberg et al., 2001 and Emanuel, 2005), and North American and European temperatures (Sutton and Hodson, 2005, Knight et al., 2006 and Mann et al., 2009). Furthermore, evidence derived from palaeoceanographic records suggests that a reduction in the meridional heat transport through the surface components of the AMOC was in part responsible for the reductions in temperatures associated with the Medieval Climate Anomaly (MCA; 1000–1450) to Little Ice Age (LIA; 1450–1850) transition (Lund et al., 2006, Trouet et al., 2009, Trouet et al., 2012, Wanamaker et al., 2012 and Moffa-Sánchez et al., 2014).”
12. Hao and He, 2017 “Using long-term observational data and numerical model experiments, this study found that the Atlantic Multidecadal Oscillation (AMO) affects the influence of ENSO-like sea surface temperature anomalies (SSTAs, which contain variability of both El Niño-Southern Oscillation and Pacific Decadal Oscillation) on the interannual change in the East Asian winter monsoon (EAWM). In the observations, the out-of-phase relationship between the ENSO-like and EAWM was significantly intensified when the AMO and ENSO-like were in-phase. Warmer-than-normal winters occurred across East Asia when the ENSO-like and AMO were positively in-phase, with a significantly weakened Siberian High and anomalous anticyclones over the western North Pacific. The opposite patterns occurred under negatively in-phase conditions.”
13. Reischelmann et al., 2017 “We document that long-term patterns in temperature and precipitation are recorded in dripwater patterns of Bunker Cave and that these are linked to the North Atlantic Oscillation (NAO).”
14. Zaitchik, 2017 “The Madden-Julian Oscillation (MJO) is the dominant mode of sub-seasonal climate variability in the global tropics. As such it represents an opportunity for intra-seasonal rainfall prediction and, perhaps, for explaining dynamics that underlie longer term variability and trends. … A number of studies have identified statistical links between MJO [Madden-Julian Oscillation] and sub-seasonal rainfall variability in West, East, and Southern Africa. … On longer time scales, there is evidence that MJO activity both modulates and is modulated by the El Niño Southern Oscillation and the Indian Ocean Dipole. The implications of these interactions for MJO connections to Africa require further research, as does the potential for trends in MJO behavior and impacts on Africa under global climate change.”
15. Wu et al., 2017 “The enhanced warming observed in the Eastern China Coastal Waters (ECCW) during the last half-century has received considerable attentions. However, the reason for this warming is still a subject of debate. Based on four different Sea Surface Temperature datasets, we found that the most significant warming occurred in boreal winter during 1982–1998, although the warming trends derived from these datasets differ in magnitude. We suggest that the rapid warming during winter is a result of the asymmetry in the El Niño–Southern Oscillation teleconnection, through which El Niño events induce significant warming over the ECCW at its peak, whereas La Niña events fail to do the opposite that would completely reverse the trends; in addition, there were more El Niño than La Niña events during the recent decades. All these contribute to the winter warming during 1982–1998.”
Natural Variability Dominates Sea Levels, Flooding … Seas Rising Only 1.7 mm/yr
16. Parekh et al., 2017 “The rate of sea level rise over the Arabian Sea is about 0.5–3 mm/year, whereas over the Bay of Bengal, it is 0.75–6 mm/year. Major contributors to these changes in the Indian Ocean are steric effect and short-term climate variability such as El Niño–Southern Oscillation (ENSO) and the Indian Ocean Dipole. This affirms that sea level trends over north Indian Ocean get modulated by inter-annual and decadal scale natural climate variability. The inter-annual variability is stronger than decadal variability, which in turn is stronger than the long-term sea level trend. Sea level change in the Indian Ocean is about 1.5 mm/year in the past sixty years or so, whereas the global sea level trends are a bit higher [1.7 mm/yr].”
17. McAneney et al., 2017 “Global averaged sea-level rise is estimated at about 1.7 ± 0.2 mm year−1 (Rhein et al. 2013), however, this global average rise ignores any local land movements. Church et al. (2006) and J. A. Church (2016; personal communication) suggest a long-term average rate of relative (ocean relative to land) sea-level rise of ∼1.3 mm year. …The data show no consistent trend in the frequency of flooding over the 122-year [1892-2013] duration of observations despite persistent warming of air temperatures characterized in other studies. On the other hand, flood frequencies are strongly influenced by ENSO phases with many more floods of any height occurring in La Niña years. … In terms of flood heights, a marginal statistically significant upward trend is observed over the entire sequence of measurements. However, once the data have been adjusted for average sea-level rise of 1.3 mm year−1 over the entire length of the record, no statistically significance remains, either for the entire record, or for the shortened series based on higher quality data. The analysis of the uncorrected data shows how the choice of starting points in a time series can lead to quite different conclusions about trends in the data, even if the statistical analysis is consistent. … In short, we have been unable to detect any influence of global warming at this tropical location on either the frequency, or the height of major flooding other than that due to its influence on sea-level rise.”
– See more at: http://notrickszone.com/2017/02/27/20-new-papers-affirm-modern-climate-is-in-phase-with-natural-variability/#sthash.G4zIljkW.dpuf