18 New Papers Link High Solar Activity To Medieval And Modern Warmth, Low Solar Activity To Little Ice Age Cooling
“It is generally accepted that the climate warms during periods of strong solar activity (e.g., the Medieval Warm Period) and cools during periods of low solar activity (e.g., the Little Ice Age).” —Lyu et al., 2016
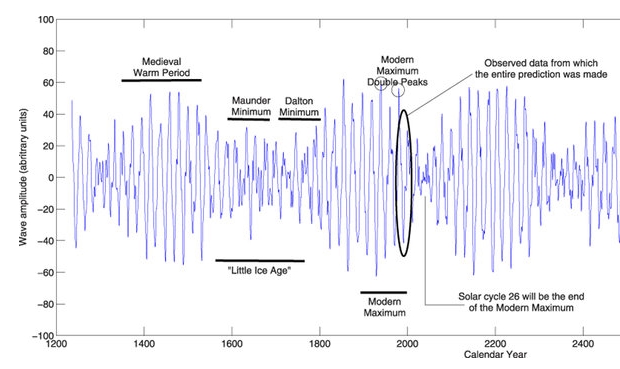
Within the last 1,000 years, global-scale surface temperatures underwent a warm period during Medieval times, centennial-scale cooling during the 14th to 19th centuries, and another warm period since the early 20th century. According to scientists publishing in the peer-reviewed scientific literature within the last several months (2016), these long-term thermal changes are well correlated with long-term variations in solar activity, namely the Medieval Solar Maximum (Medieval Warm Period), Spörer, Maunder and Dalton Minimums (Little Ice Age), andModern Grand Maximum (20th Century). Scientists Zharkova and colleagues (2015) provide a cogent summary with a user-friendly graphic denoting the solar changes and their correspondence with warming and cooling trends.
“The longest direct observation of solar activity is the 400-year sunspot-number series, which depicts a dramatic contrast between the almost spotless Maunder and Dalton minima, andthe period of very high activity in the most recent 5 cycles [1950s – 2000s], prior to cycle 24. … The records show that solar activity in the current cycle 24 is much lower than in the previous three cycles 21–23 revealing more than a two-year minimum period between cycles 23 and 24. This reduced activity in cycle 24 was very surprising because the previous five cycles were extremely active and sunspot productive forming the Modern Maximum. … We predict correctly many features from the past, such as: 1) an increase in solar activity during the Medieval Warm period; 2) a clear decrease in the activity during the Little Ice Age, the Maunder Minimum and the Dalton Minimum; 3) an increase in solar activity during a modern maximum in 20th century.”
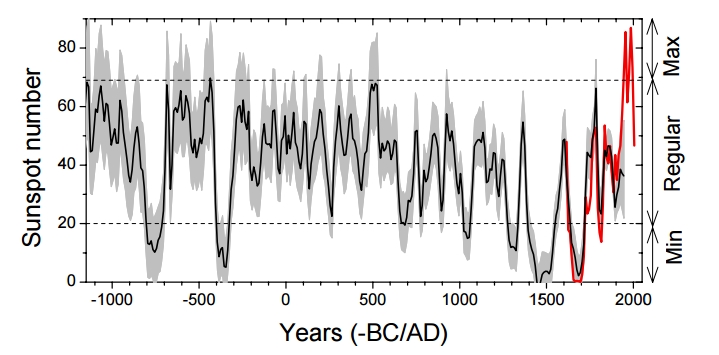
“The corrected series is provided as supplementary material in electronic form and displays secular minima around 1800 (Dalton Minimum) and 1900 (Gleissberg Minimum), as well as the Modern Grand Maximum of [solar] activity in the second half of the twentieth century. The uniqueness of the grand maximum is confirmed for the last 250 years.”
“[T]he modern Grand maximum (which occurred during solar cycles 19–23, i.e., 1950–2009) was a rare or even unique event, in both magnitude and duration, in the past three millennia. Except for these extreme cases, our reconstruction otherwise reveals that solar activity is well confined within a relatively narrow range.”
Below is a list of 18 peer-reviewed papers published in 2016 that support the position that changes in solar activity are well correlated with warming and cooling periods for the last millennium.
“Solar activity (SA) has non-linear characteristics that influence multiple scales in solar processes (Vlahos and Georgoulis, 2004). For instance, millennia-scale solar oscillations have been recently detected, like those of about 6000 and 2400 years, by Xapsos and Burke (2009) and Charvátová (2000), respectively, with important and interesting influences in the near, past and future climate. These millennialscale patterns of reconstructed SA [solar activity]variability could justify epochs of low activity, such as the Maunder minimum [Little Ice Age cooling], as well as epochs of enhanced [solar] activity, such as the current Modern Maximum[20th century warming], and the Medieval maximum [Medieval Warm Period] in the 12th century. … We can conclude that the evidence provided is sufficient to justify a complete updating and reviewing of present climate models to better consider these detected natural recurrences and lags in solar processes.”
“The results demonstrate both abrupt changes and a clear centennial-bicentennial variability for the last millennium. The Medieval Climate Anomaly (MCA) between 1000 and 1200 CE represents the warmest ocean surface conditions of the SE Greenland shelf over the late Holocene (880 BCE-1910 CE). MCA in the current record is characterized by abrupt, decadal to multidecadal changes, such as an abrupt warming of ~2.4 °C in 55 years around 1000 CE. [0,5 Temperature changes of these magnitudes are rarely observed in other proxy records from the North Atlantic. … A cool phase, from 1200-1890 CE, associated with the Little Ice Age (LIA), ends with the rapid warming of aSST and diminished aSIC in the early 20th century. The phases of warm aSST and aSIC minima on the SE Greenland shelf and solar minima of the last millennium are antiphased, suggesting that solar forcing possibly amplified by atmospheric forcing has been behind the aSST variability on the SE Greenland over the last millennium.”
“The reconstructed April–July MMT series exhibited six cold and seven warm periods. The longest cold period lasted from AD 1645 to 1677 (33 years), with an average temperature of 0.5 ◦C below the mean value.The longest warm period, however, lasted from AD 1767 to 1785 (19 years), and the average temperature was 0.69 ◦C above the mean value (Table 4). Four cold (1605–1616, 1645–1677, 1911–1924, and 1951–1969) and warm (1795–1807, 1838– 1848, 1856–1873, and 1991–2008) periods were consistent with other results of tree-ring reconstructions in northeast China (Shao and Wu, 1997; Yin et al., 2009; Wang et al., 2012; Zhu et al., 2015). In addition, two cold periods (1645– 1677 and 1684–1691) were consistent with the Maunder Minimum (1645–1715), an interval of decreased solar irradiance (Bard et al., 2000). … The three temperature series exhibited significantly low temperature periods during the 1950s–1970s, which coincided with a slight decrease in solar activity from AD 1940 to 1970 (Beer et al., 2000; Fig. 7).”
“[P]revious studies suggest that climate change in northeast China was also linked to the solar activities and global land–sea atmospheric circulation during certain pre-instrumental periods (Chen et al., 2006; Wang et al., 2011; Liu et al., 2013). It is generally accepted that the climate warms during periods of strong solar activity (e.g., the Medieval Warm Period) and cools during periods of low solar activity (e.g., the Little Ice Age; Lean and Rind, 1999; Bond et al., 2001).”
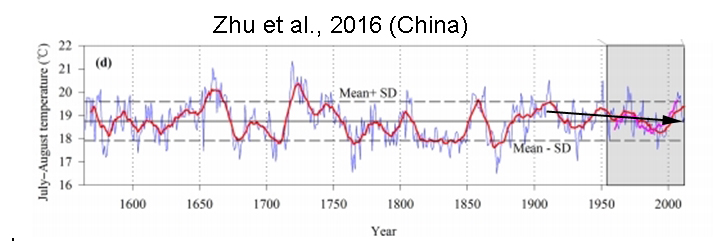
“During the period 1875–1955, late summer temperature fluctuated less strongly than before or thereafter. In general, the average length of cold periods was shorter than that of warm periods. The cold period of 1869–1877 was the longest and coldest cool period had a mean of 17.63°C. The longest warm period extended from 1655 to 1668, and the warmest period in AD 1719–1730 had a mean of 20.37°C. However, we should point out that the rapid warming during the 20th century was not especially obvious in our reconstructed RLST.”
“[S]even cold periods and three warm periods were identified during the past 368 years (Fig. 4d). All the cold periods were during the Maunder (1708–1711) or Dalton (1818– 1821, 1824–1828, 1832–1836, and 1839–1842) solar minima periods, except for the cold periods of 1765–1769 and 1869–1877 (Eddy, 1976; Shindell et al., 1999), which indicated that RLST [mean maximum temperature] variations in the NWSP [northwestern Sichuan Plateau, China ] might be driven by solar activity. … Warm periods of 1719–1730 and 1858–1859 both had more sunspots (Eddy, 1976; Shindell et al., 1999) and lower volcanic forcing (Fig. 7b).”
“[S]ignificant multidecadal- and centennial-scale cycles of our temperature reconstruction might include the signs of solar activity, such as the Gleissberg cycles (Peristykh and Damon, 2003), Suess cycles (Braun et al., 2005), Bruckner cycles (Raspopov et al., 2004), and Schwabe cycles (Braun et al., 2005). The Maunder (ca. AD 1645–1715) and Dalton (ca. AD 1790–1840) solar minima periods were generally associated with temperature depressions (Eddy, 1976), and the Damon (ca. AD 1890– 1920) solar maximum period occurred in a relatively warm period, which further confirmed that late summer temperature variation in the NWSP [northwestern Sichuan Plateau, China ] might be driven by solar activity (Fig. 7b).”
“The dominant warm and arid conditions during the MCA [Medieval Climate Anomaly, 900-1300 CE], and the cold and wet conditions during the LIA [Little Ice Age, 1300-1850 CE] indicate the interplay of the NAO+, EA+ and NAO- , EA- [positive/negative North Atlantic Oscillation, East Atlantic phases], respectively. Furthermore, the higher solar irradiance during the [“warm conditions”] RP [Roman Period, 200 BCE – 500 CE] and MCA [Medieval Climate Anomaly, 900-1300 CE] may support the predominance of the EA+ [positive East Atlantic] phase, whereas the opposite scenario [“colder temperatures”] during the EMA [Early Middle Age, 500-900 CE] and LIA [Little Ice Age, 1300-1850 CE] may support the predominance of the EA- [negative East Atlantic] phase, which would favour the occurrence of frequent and persistent blocking events in the Atlantic region during these periods.”