Special to Climate Depot
‘UNSTOPPABLE COLLAPSE’ OF THE WEST ANTARCTIC ICE SHEET?’ ‘11-FOOT RISE IN SEA LEVEL?’ MIAMI, NEW ORLEANS AND NEW YORK DROWNED? 12.8 MILLION AMERICANS SUBMERGED WITH $2.4 TRILLION PROPERTY LOSS? A REALILTY CHECK
Dr. Don J. Easterbrook, Western Washington University, Bellingham, WA [Geologist Dr. Don J. Easterbrook, Emeritus Professor at Western Washington University, a UN IPCC expert reviewer, has authored ten books and 150 journal publications. Presented 31 research papers at international meetings in 13 countries outside the US]
![Geologist Dr. Don Easterbrook debunks ‘absurd’ new warmist study claiming 1,700 U.S. cities will be below sea level by 2100 — Easterbrook: ‘The rate used by [Lead Author] Strauss for his predictions is more than 10 times the rate over the past century!’](http://graphics8.nytimes.com/images/2007/03/13/science/gore.2.190.jpg)
Last May, a New York Times headline stated “Scientists Warn of Rising Oceans From Polar Melt” and goes on to say: “A large section of the mighty West Antarctica ice sheet has begun falling apart and its continued melting now appears to be unstoppable” and “the melting could destabilize neighboring parts of the ice sheet and a rise in sea level of 10 feet or more may be unavoidable in coming centuries.” Virtually every newspaper and TV news show went ballistic with dire predictions of the ‘unstoppable’ catastrophe about to unfold. The two papers on Pine Island and Thwaites glaciers in West Antarctica that triggered this avalanche of alarmism have just recently been published and have triggered a renewed outburst of catastrophic predictions.
A Washington Post headline states “Research casts alarming light on decline of West Antarctic glaciers” and goes on to say that “a rapidly melting section of the West Antarctic ice sheet appears to be in an irreversible state of decline, with nothing to stop the glaciers in this area from melting into the sea” and “the region’s mile-thick ice sheet could collapse and raise sea levels as much as 11 feet.” “The consequences of such an amount of sea-level rise for the United States — or for any other coastal region — are staggering to contemplate.” “12.8 million Americans live on land less than 10 feet above their local high-tide line.” “$2.4 trillion worth of property is occupying this land, excluding Hawaii and Alaska.” “The cities that would be most affected include Miami, New Orleans, and New York.” “Within 100 to 200 years, one-third of West Antarctica could be gone.” “The effects of climate change are outpacing scientific predictions, driven in part, scientists say, by soaring levels of greenhouse gases in the atmosphere.”
A bit worrisome? Start building an ark? Let’s take a look at the reality of the situation in Antarctica and put all of this into proper perspective. We’ll look at (1) the basis for these catastrophic predictions, (2) just how much ice is involved in these two outlet glaciers relative to the total Antarctic ice sheet, (3) at present melting rates, how long would it take for ‘collapse’ of the 1000-mile-wide-ice sheet, (4) is ‘unstoppable collapse of the West Antarctic ice sheet’ plausible, (5) is the bedrock floor of the West Antarctic ice sheet deeper below sea level than the thickness of the ice sheet (which would necessary to cause ‘collapse’ of the ice sheet), (6) what is the geothermal heat flow under these glaciers and could it cause accelerated melting?

Figure 1. Antarctica. The West Antarctic ice sheet accounts for only 8½ % of Antarctic ice and the Pine Island glacier (red dot) makes up only about 10% of that. The East Antarctic ice sheet makes up more than 90% of Antarctic ice and has been growing. (NASA image)
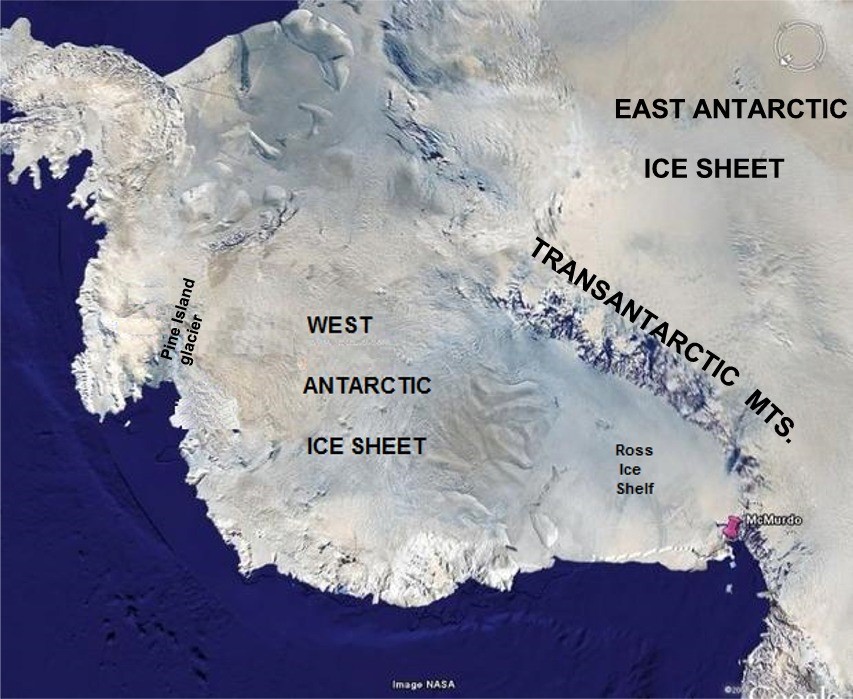
Figure 2. West Antarctic ice sheet.
WHAT IS THE BASIS FOR THESE CATASTROPHIC PREDICTIONS?
The authors of the Pine Island paper, Justin Gillis and Kenneth Chang, say in their paper: “…we find no major bed obstacle that would prevent the glaciers from further retreat and draw down the entire basin.” In a second paper, “Marine Ice Sheet Collapse Potentially Underway for the Thwaites Glacier Basin, West Antarctica,” the authors, Joughin, Smith, and Medley, also infer that the entire West Antarctic ice sheet will soon disappear, resulting in a sea level rise of up to 10 feet. Both papers predict ‘collapse’ of the entire West Antarctic ice sheet based on retreat of two outlet glaciers that drain a tiny part of the ice sheet. The authors contend that recent retreat of the Pine Island and Thwaites glaciers has occurred because warm ocean water has caused melting of ice on the underside of the glaciers, causing them to thin and calve more rapidly. Because the base of most of the West Antarctic ice sheet lies below sea level, the authors contend that ocean water will melt its way up several small embayments under the ice sheet, which is more than 1000 miles across, and cause it to collapse abruptly. They refer to this as “unstoppable” because the glacier base is below sea level and they claim that there is nowhere that the glacier can ground resulting in total collapse of the ice sheet into the sea. What does ‘collapse’ mean? Dictionaries define collapse as ‘to fail abruptly, come to a sudden end.’
The prediction of catastrophic collapse of the entire West Antarctic ice sheet is based on several lines of evidence:
- The Pine Island and Thwaites glaciers have shown recent increases in calving of the ice margin and retreat of their termini.
- The base of the West Antarctic ice sheet is mostly 1,000 m (3,300 ft) below sea level, so if warm ocean water can intrude under the ice, it might cause melting of basal ice at the terminus, resulting in calving and rapid retreat of the ice terminus. As the ice retreats, if there are no more grounding line positions, calving could accelerate and cause collapse of the ice sheet, raising sea level 10 feet.
These assertions are not new—36 years ago, Mercer (1978) suggested that the West Antarctic ice sheet was potentially unstable and others have commented on it before and since then. Here is what some have said: Calving of large icebergs is a natural process unrelated to warming–this ice shelf and others spawn huge icebergs every 6-10 years. Releasing a huge iceberg, by itself, is a normal process. Collapse of Pine Island glacier, if it did occur, would take 1000-2000 years, but it is unlikely to contribute to more than 2.7 cm of sea level rise over the next 100 years. Every 10 years or so ice shelves calve large icebergs, which are not worrisome. This ice stream is unlikely to collapse in our lifetime.
HOW MUCH ICE IS INVOLVED IN THESE GLACIERS RELATIVE TO THE TOTAL ANTARCTIC ICE SHEET?
To get a perspective of what is happening now and what might or might not happen in the future requires a look at the overall geologic setting and the scale of the size and thickness of the West Antarctic ice sheet relative to the Pine Island and Thwaites glaciers. The West Antarctic ice sheet (Figure 1) makes up only about 8½ % of Antarctic ice, and the Pine Island glacier makes up about 10% of the West Antarctic ice sheet. The East Antarctic ice sheet makes up more than 90% of Antarctic ice. Most of the West Antarctic ice sheet lies SE of the Pine Island glacier and at its SW margin is about 1000 miles from the Pine Island and Thwaites outlet glaciers. Ice in the SE region flows into the Ross Sea, making the Ross Ice Shelf, and has little if anything to do with the part of the ice sheet that flows through the Pine Island and Thwaites outlet glaciers far to the north beyond the ice divide. The Pine Island and Thwaites glaciers are not independent glaciers—they are ice streams from the NW part of the West Antarctic ice sheet flowing through narrow embayments bounded by mountains. Their termini calve into the Amundsen Sea, but the rest of the ice sheet is grounded and all of the southwestern part discharges into the Ross Sea (Figures 3, 4). The entire western and southern margins of the West Antarctic ice sheet are separated from the ocean by mountains so these are virtually the only outlets for the ice. The total width of the Pine Island and Thwaites outlet glaciers makes up only about 60 miles of the 2,500 miles of coastline along the western and southern margins of the ice sheet. The major ice discharge from the SW margin into the Ross ice shelf is not affected by what goes on in the northern part of the ice sheet. Scale is important–only when looking a map of the size of the West Antarctic ice sheet does it become apparent just how tiny the Pine Island and Thwaites outlet glaciers are relative to the size of the West Antarctic ice sheet (Figures 3, 4). King and colleagues latest refinement puts the Antarctic contribution to global sea level rise at a rate of about one-fifth of a millimeter per year (0.71 inches per century).
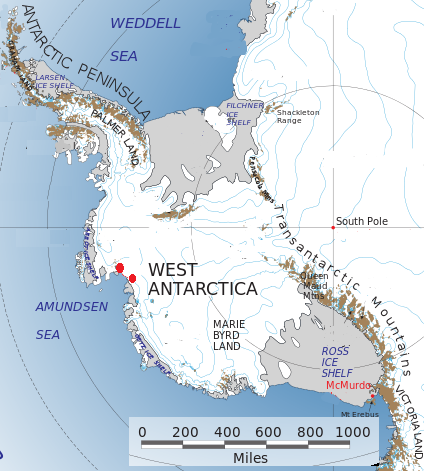
Figure 3. Location of the Pine Island and Thwaites glaciers (red dots) and the West Antarctic ice sheet. The ice sheet is bounded along its entire south coast by mountains so most of the ice discharges into the Ross ice shelf and several narrow gaps in the mountains where ice discharges into the Amundsen Sea. Note how much larger the ice sheet margin is at the Ross Sea outlet than that of the Amundsen Sea outlet. (Modified from Wikipedia).
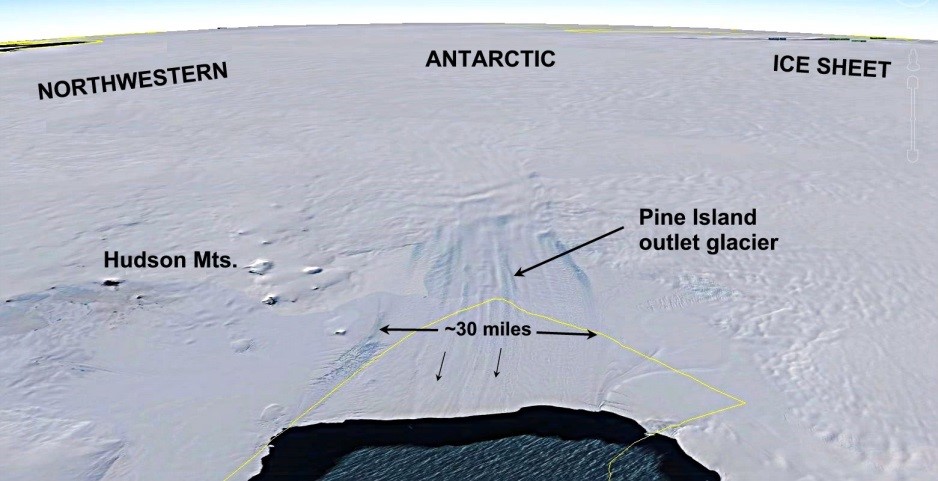
Figure 4. Pine Island outlet glacier and the northwestern part of the West Antarctic ice sheet. (modified from Google Earth)
HOW LONG WOULD ‘COLLAPSE’ OF THE 1000-MILE-WIDE-ICE SHEET TAKE AT PRESENT MELTING RATES
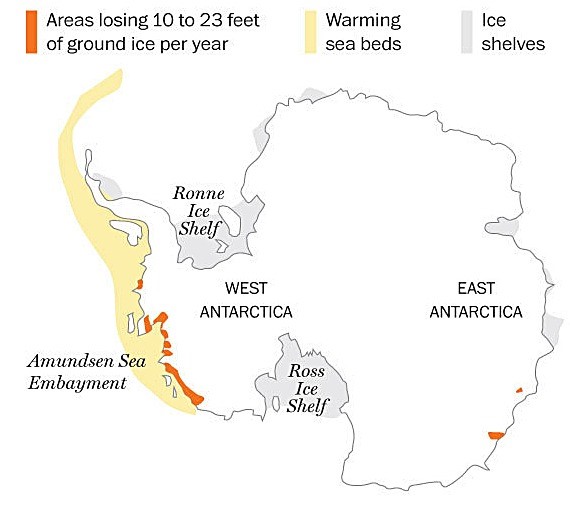
Figure 5 from ‘Runaway glaciers,’ by Patterson and Clark, Dec. 4, shows an interpretation of the rate of West Antarctic ice loss per year at 10 to 23 feet per year. As shown on Figure 3, the West Antarctic ice sheet is roughly 800-1000 miles (5,280,000feet) across, depending on where you measure it. So melting at 10 feet per year would take 528,000 years and at 23 feet per year would take 229,565 years. Hardly collapsing!
Figure 5. West Antarctic ice low. (From ‘Runaway glaciers,’ Patterson and Clark,Dec. 4, 2014)
IS ‘UNSTOPPABLE COLLAPSE OF THE WEST ANTARCTIC ICE SHEET’ CREDIBLE?
The Big Picture– Geologic Setting
The base of most of the West Antarctic ice sheet lies below sea level (Figure 6) and it is because of this that the West Antarctic ice sheet is predicted to collapse. The deepest parts of the subglacial basin are mostly about 1000 m (3,300 ft) deep and lie beneath the central portion of the ice sheet where the ice is the thickest (Figure 7). More important than just depth below sea level is how thick the ice is relative to the depth below sea level.
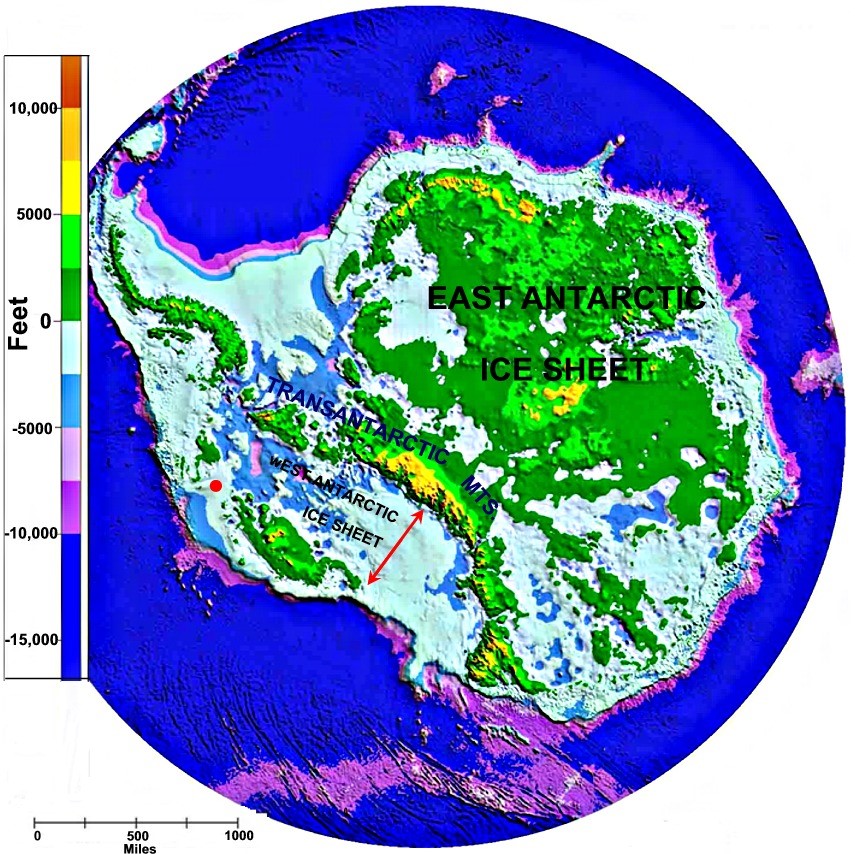
Figure 6. Subglacial topography in Antarctica. Most of the West Antarctic ice sheet lies below sea level, shown in dark and light blue. (modified from Wikipedia)
Thickness of the West Antarctic Ice Sheet
Figure 7 shows the thickness of the West Antarctic ice sheet. The ice is more than 3,000 feet thick in the darker red areas and most of the ice sheet is more than 2,000 feet thick. The importance of ice thickness is that virtually all of the ice sheet is considerably thicker than the depth below sea level to bedrock, so the ice is grounded and will not float.
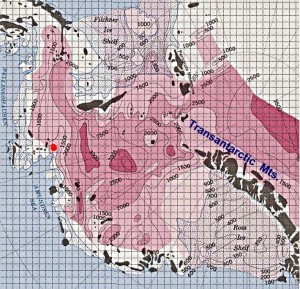
Figure 7. Thickness of the West Antarctic ice sheet.
Also important is the source area of the outlet glaciers. Figure 8 shows ice divides and ice drainage areas. The Pine Island outlet glacier drains only a relative small portion of the West Antarctic ice sheet so it is difficult to see how events there could result in collapse of the entire Antarctic ice sheet.
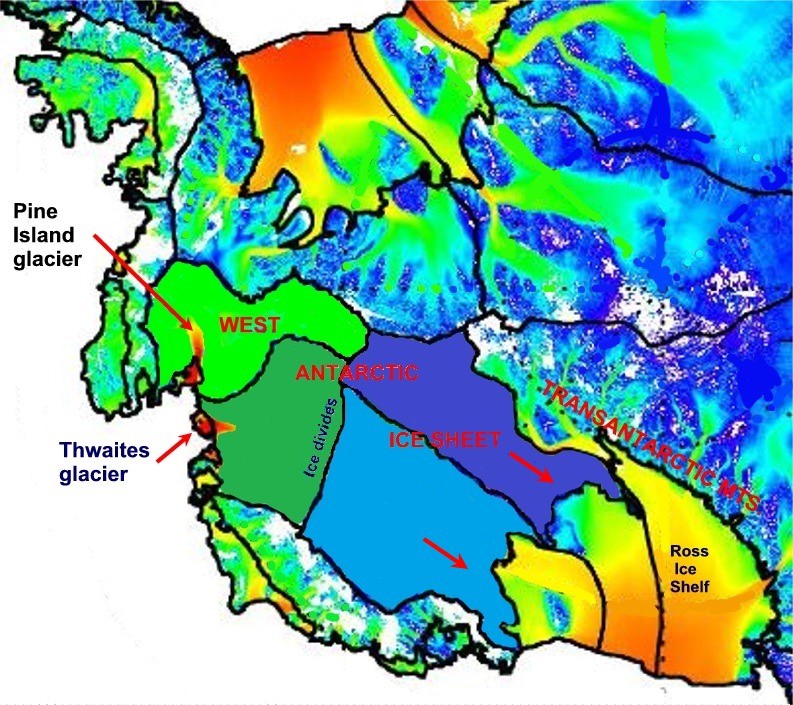
Figure 8. Ice divides and ice drainages in the West Antarctic ice sheet. Light green is the area of ice draining into the Pine Island glacier; dark green is ice draining into the Thwaites glacier; light and dark blue is ice draining into the Ross Sea (modified from http://icesat4.gsfc.nasa.gov/cryo_data/Rignot_velocity_maps.php)
The authors assert that “…we find no major bed obstacle that would prevent the glaciers from further retreat and draw down of the entire basin.” but that is contrary to what is shown on Figure 9, which is a profile of the West Antarctic ice sheet from the east coast to the Transantarctic Mts., showing thickness of the ice sheet, sea level, and the subglacial floor. At its deepest part, the subglacial floor is 2,000 m (6,500 ft) below sea level, but almost all of the subglacial floor in this profile is less than 1,000 m (3,300 ft) below sea level. The ice is mostly more than 2,500 m (8,000 ft) thick, so basic physics tells us it will not float in 1,000 m (3,300 ft) of water nor will sea water melt its way under the ice. 200 km (125 miles) up-ice from the terminus, the ice sheet is about 1600 m (5,200 ft) thick and the subglacial floor is above sea level. 300 km from the terminus, the subglacial floor is 1,000 m (3,300 ft) above sea level. About 700 km from the terminus, the ice is about 1,700 m (5,500 ft) thick and the subglacial floor is near sea level. About 1,050 to 1,150 km (650-700 miles) from the terminus, bedrock occurs at sea level. Because the depth of the subglacial floor below sea level is substantially less than the thickness of ice, it will not float and collapse!

Figure 9. Profile through the West Antarctic ice sheet from the Amundsen Sea to the Transantarctic Mts. (Modified from http://antarcticglacier.org)
GEOTHERMAL HEAT FLOW UNDER THE ICE SHEET
In a paper “Evidence for elevated and spatially variable geothermal flux beneath the West Antarctic Ice Sheet” published in May, 2014, Schroeder et al. presented evidence of elevated geothermal heat flow beneath the Thwaites glacier (Figure 10) that “is likely a significant factor in local, regional, and continental-scale ice sheet stability.” “Thwaites Glacier is one of the West Antarctica’s most prominent, rapidly evolving, and potentially unstable contributors to global sea level rise. Uncertainty in the amount and spatial pattern of geothermal flux and melting beneath this glacier is a major limitation in predicting its future behavior and sea level contribution.”
“Geothermal flux is one of the most dynamically critical ice sheet boundary conditions estimate the distribution of basal melting and geothermal flux beneath Thwaites Glacier, West Antarctica. We show that the Thwaites Glacier catchment has a minimum average geothermal flux of ∼114 ± 10 mW/m2 with areas of high flux exceeding 200 mW/m2 consistent with hypothesized rift-associated magmatic migration and volcanism. These areas of highest geothermal flux include the westernmost tributary of Thwaites Glacier adjacent to the subaerial Mount Takahe volcano and the upper reaches of the central tributary near the West Antarctic Ice Sheet.”

Figure 10. Geothermal heat flow beneath the Thwaites glacier. ‘A’ is Mt. Takahe, a volcano. Darker red colors represent areas of highest geothermal heat flow.
“Large areas at the base of Thwaites Glacier are actively melting in response to geothermal flux consistent with rift-associated magma migration and volcanism. This supports the hypothesis that heterogeneous geothermal flux and local magmatic processes could be critical factors in determining the future behavior of the West Antarctic Ice Sheet.”
“The distribution of melt and geothermal flux (Figure 10) includes several regions with high melt that are closely related to rift structure and associated volcanism. These include the entire westernmost tributary that flanks Mount Takahe (Figure 10, location A), a subaerial volcano active in the Quaternary and several high-flux areas across the catchment adjacent to topographic features that are hypothesized to be volcanic in origin We also observe high geothermal flux in the upper reaches of the central
tributaries that are relatively close to the site of the West Antarctic ice sheet Divide ice core (Figure 10, location B), where unexpectedly high melt and geothermal flux have been estimated.”
“Our results produce high melt values adjacent to known volcanoes and structures that are morphologically suggestive of volcanic origin. We believe that both the magnitude and spatial pattern of geothermal flux we present reflect the geologic and glaciological reality of the Thwaites Glacier bed and that contrary to previous modeling, our results show regions of high geothermal flux that are in substantial agreement with levels inferred from the ice core drilling site near the ice divide for the Thwaites catchment.”
“Our results further suggest that the subglacial water system of Thwaites Glacier may be responding to heterogeneous and temporally variable basal melting driven by the evolution of rift-associated volcanism and support the hypothesis that both heterogeneous geothermal flux and local magmatic processes could be critical factors in determining the future behavior of the WAIS.”
CONCLUSIONS
The evidence above shows that:
- The West Antarctic ice sheet makes up only about 8% of Antarctic ice, and the Pine Island glacier makes up only about 10% of the West Antarctic ice sheet. The East Antarctic ice sheet makes up more than 90% of Antarctic ice. Most of the West Antarctic ice sheet lies SE of the Pine Island glacier and at its SW margin is about 1000 miles from the Pine Island and Thwaites outlet glaciers.
- The Pine Island and Thwaites outlet glaciers drain less than half of the West Antarctic ice sheet, so it is not plausible that they could cause collapse of the entire ice sheet.
- The Pine Island and Thwaites outlet glaciers are only about 30 miles across so draining 2.2 million km3 of ice through their narrow channels or sending sea water 1,000 miles under the ice sheet isn’t plausible.
- Most of the ice sheet is much thicker (2,500 m (8,000 ft) than the depth of the subglacial floor below sea level (1,000 m (3,300 ft) so the ice will not float and sea water will not extend under the ice.
- Almost all of the West Antarctic ice sheet subglacial floor is less than 1,000 m (3,300 ft) below sea level. The ice is mostly more than 2,500 m (8,000 ft) thick, so the ice sheet will not float in 1,000 m (3,300 ft) of water nor will sea water melt its way under the ice.
- Studies of subglacial geotherm heat flow show that the area under the Thwaites glacier is unusually high and is the most like cause of subglacial melting, rather than ocean water.
7. The West Antarctic ice sheet is NOT collapsing, the retreat of these small glaciers is NOT caused by global warming, and sea level is NOT going to rise 10 feet.
#