Exclusive to Climate Depot

Geologist Dr. Don Easterbrook, professor emeritus of geology at Western Washington University and author of 150 scientific journal articles and 10 books, including “Evidence Based Climate Science,” issued a point-by-point rebuttal to the new NOAA climate report and the media articles surrounding it.
Live Science: ‘Climate Records Shattered in 2013’ – By Becky Oskin, Senior Writer | LiveScience.com – July 18, 2014 – “The climate is changing more rapidly in today’s world than at any time in modern civilization,” said Thomas Karl, director of NOAA. (NOAA State Of The Climate In 2013: ‘Our Planet Is Becoming A Warmer Place’)
Climate Claim: “The planet ranged well outside of normal levels in 2013, hitting new records for greenhouse gases.”
Dr. Easterbrook comment: “NOT TRUE–CO2 levels for the past 500 million years were consistently greater than 3,000 ppm. 400ppm is abnormally low.
[Climate Depot Related Links: CO2 at 400ppm: ‘Scientists note that geologically speaking, the Earth is currently in a ‘CO2 famine‘ and that the geologic record reveals that ice ages have occurred when CO2 was at 2000 ppm to as high as 8000 ppm. In addition, peer-reviewed studies have documented that there have been temperatures similar to the present day on Earth when carbon dioxide was up to twenty times higher than today’s levels’ – And, a peer-reviewed study this year found that the present day carbon dioxide level of 400 ppm was exceeded — without any human influence — 12,750 years ago when CO2 may have reached up to 425 ppm.]
#
Climate Claim: “The levels of carbon dioxide in Earth’s atmosphere at Mauna Loa Observatory in Hawaii hit 400 parts per million (ppm) for the first time in 2013. The worldwide average reached 395.3 ppm, a 2.8 ppm increase from 2012, NOAA reports. (Parts per million denotes the volume of a gas in the air; in this case, for every 1 million air molecules, 400 are carbon dioxide.)”
Dr. Easterbrook comment: “The CO2 composition of the atmosphere changed by only 0.004% since the onset of recent global warming (1978-2000).”
#
Climate Claim: “The major greenhouse gases all reached new record high values in 2013,” said Jessica Blunden, a climate scientist with ERT, Inc., and a NOAA contractor who helped write the report.
Dr. Easterbrook comment: “So what? If you double nothing (0.004%), you still have nothing!”
#
Climate Claim: “Rising sea levels. Sea level continued rising: Boosted by warm Pacific Ocean temperatures (which causes water to expand) and melting ice sheets, sea level rose 0.15 inches (3.8 millimeters), on par with the long-term trend of 0.13 inches (3.2 mm) per year over the past 20 years.”
Dr. Easterbrook: “NOT TRUE–rates of sea level rise have declined slightly and are about 1.7 mmyr. Sea level has been rising at a relatively constant rate of only ~7 inches per century–that’s 3 1/2 inches in the next 50 years.
Latest NOAA mean sea level trend data through 2013 confirms lack of sea level rise acceleration
Global sea level rise from tide gauges (1.6 mm/year) is half of that claimed from satellites (3.2 mm/year). Which is right? – ‘There is no acceleration of the increase’ – [Climate Depot Note: According to tide gauges, Sea Level is rising LESS than the thickness of one nickel (1.95 mm thick) per year or about the thickness of one penny (1.52 mm thick) a year. According to satellite info it is rising slightly more than two pennies a year (3.04 mm)]
New study finds sea levels rising only 7 in. per century – with no acceleration
#
Climate Claim: “The climate is changing more rapidly in today’s world than at any time in modern civilization,”
Dr. Easterbrook comment: NOT TRUE–Except for the Little Ice Age, all of the past 10,000 years has been 2.5 to 5.5 F warmer than today including much more intense periods of warming. It was warmer and climate changed more rapidly than in recent years during the Medieval Warm Period, as well as during half a dozen other warm periods.
Related Links: New Paper: Roman & Medieval Warm Periods Were Warmer Than Previously Thought – ‘A paper published in Nature Climate Change finds prior temperature reconstructions from tree-rings ‘may underestimate pre-instrumental [pre-1850] temperatures including warmth during Medieval and Roman times.’ Many reconstructions show temperatures during the Medieval and Roman periods were warmer than the present, and this study suggests they were even warmer than previously thought’
#
Climate Claim: “Most parts of the planet experienced above-average annual temperatures in 2013, NOAA officials said. Australia experienced its warmest year on record, while Argentina had its second warmest and New Zealand its third warmest.”
Dr. Easterbrook comment: “But only by massive tampering with temp records.”
Related Links: Global Temperature Standstill Lengthens: No global warming for 17 years 10 months – Since Sept. 1996 (214 months)
#
Climate Claim: “There was a new high-temperature record set at the South Pole, of minus 53 degrees Fahrenheit (minus 47 degrees Celsius).”
Dr. Easterbrook comment: – 53 degrees F? “That must have caused a lot of ‘melting’!”
Climate Claim: “Antarctic sea ice hit another record high: On October 1, Antarctic sea ice covered 7.56 million square miles (19.5 million square kilometers). This beats the old record set in 2012 by 0.7 percent. However, even though the Antarctic sea ice is growing, the continent’s land-based glaciers continued to melt and shrink.”
Dr. Easterbrook comment: “NOT TRUE–total Antarctic ice is increasing. There is NO melting of the East Antarctic ice sheet which contains more than 90% of Antarctic ice.”
New paper finds East Antarctic ice sheet will have negative contribution to sea levels over next 200 years – Published The Cryosphere – Paper ‘studies one of the largest ice shelves in East Antarctica and predicts increased accumulation of ice on the surface of the ice shelf will have a net contribution of decreasing sea levels over the 21st and 22nd centuries.
#
Climate Claim: “Arctic sea ice low: The Arctic sea ice extent was the sixth lowest since satellite observations began in 1979. The sea ice extent is declining by about 14 percent per decade.”
Dr. Easterbrook comment: “Not this past year–it is rebounding.”
#
Climate Claim: “Arctic heat, Temperatures over land are rising faster in the Arctic than in other regions of the planet. Fairbanks, Alaska, had a record 36 days with temperatures at 80 degrees Fahrenheit (27 degrees Celsius) or warmer. However, Greenland had a cooler than average summer.”
Dr. Easterbrook comment: “NOT TRUE–the 1920s and 1930s were warmer in the Arctic than now. This can be claimed only by tampering with past records.”
#
Climate Claim: “Melting permafrost: For the second year in a row, record high temperatures were measured in permafrost on the North Slope of Alaska and in the Brooks Range.”
Dr. Easterbrook comment: “A weather condition brought about by recent shift in the jet stream that produced record-breaking cold in the US.”
Related Links: Alaska Dispatch Dec. 2012: ‘In the first decade since 2000, the 49th state (Alaska) cooled 2.4 degrees Fahrenheit’
New paper finds 4 Alaskan glaciers are about the same size as during the Medieval Warm Period
Alaskan Villages Have Been Sinking Into Permafrost For 70 Years
Arctic ‘sea ice extent has varied naturally over the decades with some Russian data suggesting similar or even greater ice loss in some local areas in the 1930s’ – Analysis of Arctic ice: ‘Russian data shows that the [Arctic] ice was just as thin in 1940 as it is now. Models did not predict the record amount of Antarctic sea ice’
Arctic Study Countered: ‘Studies have found that Arctic temperatures have fluctuated, and are now around the same level as they were in the mid-1930s’ – ‘Scientist Igor Polyakov of the International Arctic Research Center at the U. of Alaska, Fairbanks tracked Arctic temp records from latter part of 19th century until current decade, and found that 1930s marked the warmest time during that period’
#
Climate Claim: “Extreme weather: Deadly Super Typhoon Haiyan had the highest wind speed ever recorded for a tropical cyclone, with one-minute sustained winds reaching 196 mph (315 km/h). Flooding in central Europe caused billions of dollars in damage and killed 24 people.
Dr. Easterbrook comment: “This is weather, not climate!”
Meteorologist Dr. Ryan Maue demolishes claims that Typhoon Haiyan was ‘strongest storm ever’ – ‘Fact: Haiyan is 58th Super Typhoon since 1950 to reach central pressure of 900 mb or lower from historical records’ — Maue: ’50 of 58 Super Typhoons with pressure of 900 mb or lower occurred from 1950-1987 — only 8 in past 25 years’
Strongest storm ever? ‘Haiyan ranks at number 7 among the strongest storms ever to have hit the Philippines’
Extreme Weather: “It is misleading and just plain incorrect to claim that disasters associated with hurricanes, tornadoes, floods or droughts have increased on climate timescales either in the United States or globally,” Professor Roger Pielke Jr. said in his testimony before the Senate Environment and Public Works Committee.
Hurricanes: ‘Hurricanes have not increased in frequency, intensity or normalized damage in the U.S. since 1900.
Tornadoes: Tornadoes and tropical cyclones have also not become more intense or frequent since 1950 and 1970, respectfully.
Floods & Droughts: U.S. floods have not increased in frequency or intensity since 1950, according to Professor Roger Pielke Jr., and droughts have become shorter, less frequent, and smaller over the last century. Globally, floods have changed very little in the last 60 years.
#
Climate Claim: “The ocean surface continues to warm.”
Four independent datasets show that for surface ocean temperatures, last year was among the 10 warmest years on record. The North Pacific set a new record.
Climatologist Dr. Tim Ball comment: “The data prior to the satellite data is extremely questionable. For example, there is the difference in results by water temperatures taken by dipping, leather, wooden and metal buckets. Even the first couple of years of the satellite data was problematic as they got results that were some times 6°C warmer than ocean “ground-truthing” results. As I recall the major problem was in estimating the effect of particulates in the atmosphere. There was also an issue with the effects of measuring the surface molecular layer from which molecules are constantly escaping in the evaporative cooling process. Then there is question of how much SST data is available through cloud cover?
So, at best we can consider satellite data from 1970. As Don Easterbrook and others note, hardly a significant length in temperatures that can cycle over hundreds and even thousands of years, caused by either solar input changes or circulations within the oceans. Somebody once said economists are trying to predict the tide by measuring one wave. Climate scientists are much worse. Despite all this it is the headline from NOOA’s Karl that will dominate the news and remain in the public mind.”
Climatologist Dr. Roy Spencer comments: “2014 is not quite as warm as the last time we were ramping into El Nino conditions (2009):
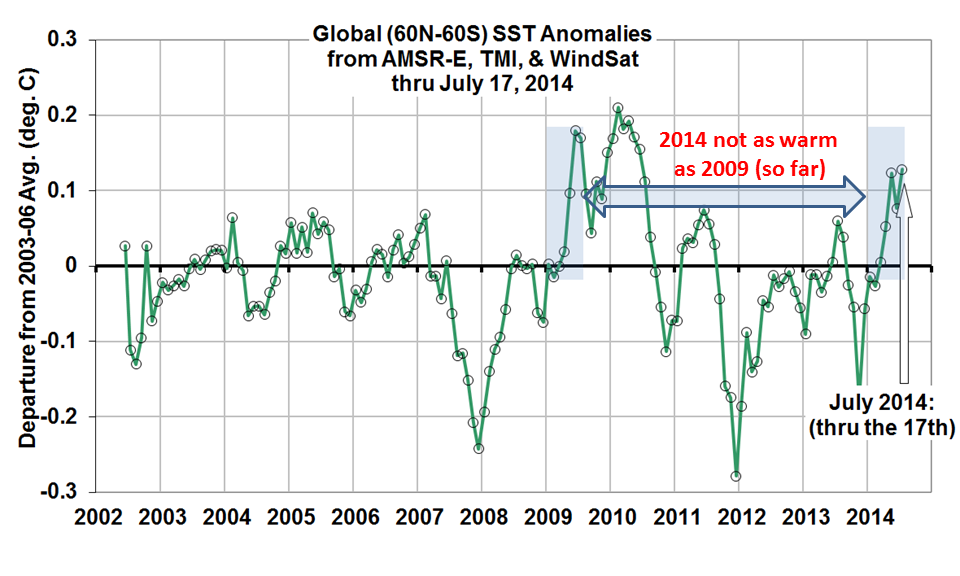
Satellite microwave SST anomalies (global) since mid-2002, updated through mid-July 2014.
#