Search
Close this search box.

Search Results for: hurricanes

Watch: Morano rebuts Elon Musk’s call for ‘carbon taxes’ to fight ‘climate change’ – ‘Paying more taxes to the government will not make hurricanes less frequent’

Watch: Morano on @tntradiolive rebuts @elonmusk on his call for 'carbon taxes' to fight 'global warming' Morano: 'Paying more taxes to the government will not make hurricanes less frequent." "It's a shell game of nonsense that's going to outsource more jobs, wealth, & energy… pic.twitter.com/nfW47fPHCT — Marc Morano (@ClimateDepot) February 6, 2024 For Morano’s full analysis go to: https://tntradio.live/shows/unleashed-with-marc-morano/ Rough Transcript: Morano: The breaking news is one of the world’s wealthiest men now says if we pay more taxes to the government, we can control climate change. Yes, Elon Musk, the X / formerly known as Twitter, owner and extraordinary Tesla and all the other Neuro link and his space programs and everything else has now put his huge brain power to climate change and is claiming that a carbon tax is the way we solve climate change. I can assure you it’s not paying more taxes to the government, will not make hurricanes less frequent, will not stop Florida from going half underwater if that’s what the earth and nature decided to do. Let’s take a look at what Elon Musk actually said and will break it down. Elon Musk video clip played Morano: Elon Musk is fascinating because he says really intelligent things and then really dumb things. And this is one of the dumb things. I go to a man named Spencer Morrison, a National Economics Institute in Canada. And this is my favorite all time analysis. See: ANALYSIS: CARBON TAXES INCREASE GLOBAL CO2 EMISSIONS. PERIOD. Carbon taxes increase global CO2 emissions, period. Good night. Good night, everyone. ♪ Ba da da da da ♪ It’s that simple. I don’t understand what Elon Musk is claiming.  First of all, any industry that gets a bigger tax is going to pass that on to consumers. So all he’s basically saying is that every socioeconomic group and it disproportionately harms the poor and the lower income, is going to be paying more for energy because no business is going to be paying more. We will all just absorb these costs. I won’t pass that on because I’m saving the planet. This is a carbon tax. We’ve got to solve climate change. This is what he actually thinks, but this is back to Spencer Morrison. The logic shows that the West’s carbon taxes invariably increase global CO2, as does the empirical evidence. And it’s incredible because if you look at carbon taxes, all they’re going to do is make our energy more expensive, burden our innovation, burden our projects, burden financing, and it just means more reliance on countries that will never have a carbon tax. And that includes China, India, Brazil, the Middle East, Russia, and all these other countries joining the BRACs and all that. It makes no sense. Why do I do it? And the other thing is once you give the government a new to, you also said in this in his claim The Elon Musk that we would reduce, You know, other taxes to compensate. Oh, that’s something great. So let me let me guess revenue neutral off We’ve solved the problem. We’re gonna have a revenue who can comply. We’re not raising taxes. This is revenue neutral now You were giving the government an entire new class category and authority to tax your inner introducing a new tax to the powers of government. Now, you could temporarily reduce some other taxes, but they’re going to go back up and this tax, and I love the other people who say, well, we’re going to limit it to this, that, and we’re going to guarantee it doesn’t go higher. Oh, really, is that like the income tax in 1913 was only one, two percent, and only on the wealthy? It’s never going to change, right? Let’s introduce this whole new authority and taxes at the end of the day. then it’s all going to be solid and done. Now, this is medieval witchcraft and it’s alive and well with the owner of X in Twitter. I don’t understand how this man, Elon Musk, could make these asinine claims. It just absolutely makes no sense. Carbon taxes increase emissions. It’s a shell game of nonsense that’s going to outsource more jobs, wealth, energy. energy production, and strategically, it puts us at a national security disadvantage. I want Elon Musk to rescind this and someone has a talk to him. And the other thing is, it’s medieval witchcraft, as I said, because what is our end game, what do you have carbon taxes? So let’s see, if a hurricane hits Florida, right? An average hurricane that they say is unprecedented because it hit some 50 miles an hour, some 50-mile stretch of beach that it never had that category three hurricane, I think. Are we going to then ratchet up the carbon tax? Three years because of that hurricane, it was really bad. Oh my gosh, there was a drought over in California. We’re gonna have to really ratchet up the carbon tax. You gotta pay your fair share. We gotta make this happen. What does that remind you of? It reminds me a lot of COVID. COVID cases are up. You’re not wearing your mask. You’re not getting the vaccine. You stay-at-home orders. We’re gonna have to cancel school longer. There we can’t. go back to, we’re going to punish you further. Churches can’t open. The cases are up. That’s because people aren’t following the rules. Carbon taxes are gonna have to go up when the weather doesn’t meet the preferred objectives. And are we gonna have any criteria for when, like, okay, finally, we’ve solved climate change? It’s going to be tied to CO2 emissions. I mean, to hell with this and Elon Musk on this. this. He is an important figure. He’s done great stuff on X slash Twitter, but he could not be more wrong on carbon taxes. And I say, go to hell if that’s your opinion. And he needs to, actually; I would like to see him. I hope there’s enough pressure brought to bear in this first week of February 2024 that he is forced to retract it and say how dumb this was. But this is one of those things where many people just say, ” oh, you know, if we actually work it through some carbon taxes, we could, oh, yeah, that would make sense. I used to say that when I worked in the Senate, environment, public works, well, the most logical way, the least damage is carbon. And it’s probably true, the least damage to the economy. I mean, at least the taxes, you get taxes, a tax as opposed to layer and layer of regulations, environment, social governance, and all the identity politics, mixing in and the corporate government collusion, all that stuff. I mean, a carbon tax is the least offensive probably of a lot of these options, but what’s our endgame? We’re not going to tax our way into a better climate, okay? This is just asinine and all you’re doing is giving the government a massive new authority to tax.

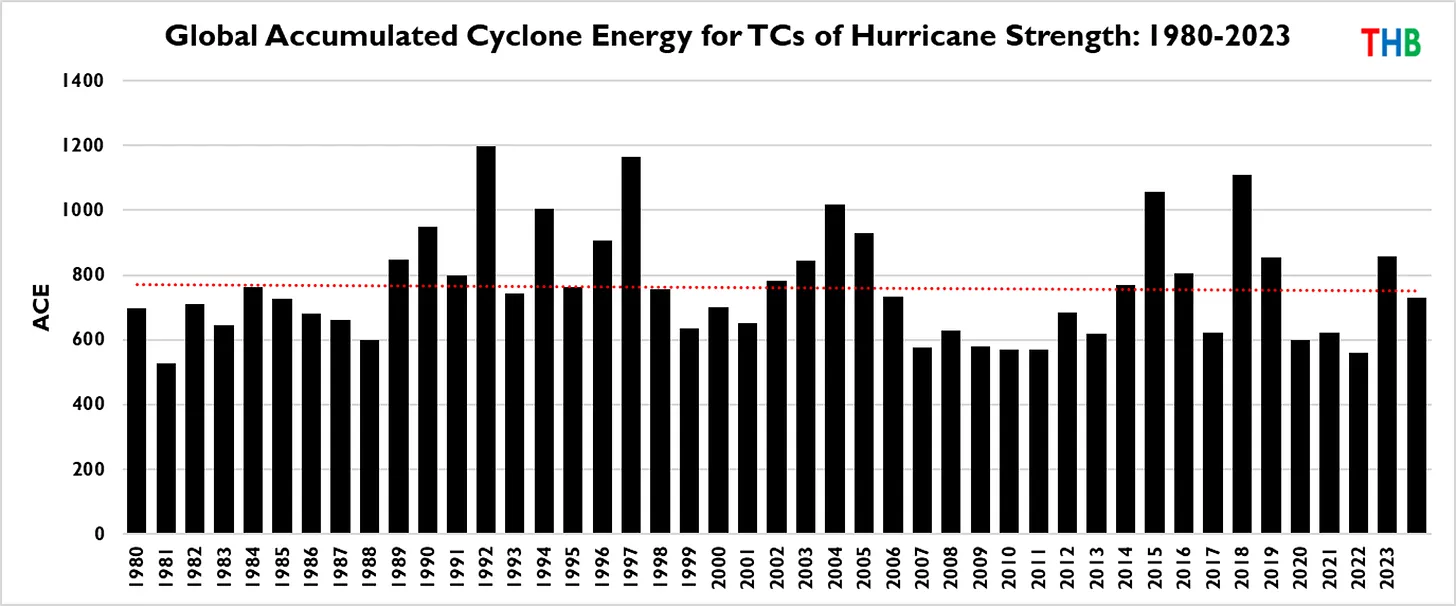
Analysis: ‘Hurricanes have not become more intense’ since 1980 based on ACE or Accumulated Cyclone Energy combining frequency & intensity

https://rogerpielkejr.substack.com/p/global-tropical-cyclones By ROGER PIELKE JR. This post is co-authored with Ryan Maue, whose Weather and Climate Substack I highly recommend. —RP Excerpts: In 2012, Jessica Weinkle, Ryan Maue and I published in the Journal of Climate the first climatology of global landfalling tropical cyclones of at least hurricane strength. Since then, Ryan and I have updated the time series every year. Landfalling hurricanes (also called typhoons or cyclones) are an important subset of tropical cyclones because these storms cause the most damage of any type of extreme event, with most of these losses occurring in the United States. The figure below shows total global landfalling hurricanes and major hurricanes, 1970 to 2023. The graph starts in 1970 because that is when reliable information is available globally, however several basins have records that go back further in time. Updated from Weinkle et al. 2012. The figure below shows the same data with linear trends for minor (Saffir/Simpson Categories 1 and 2) and major (S/S 3+) hurricanes. Updated from Weinkle et al. 2012. You can see that since 1970 there is no trend in landfalls of minor hurricanes and an upward trend in major hurricanes. Might this be the consequence of human-caused climate changes? We can get a sense of the meaningfulness of a trend that starts in 1970 by looking further back in time for the Western North Pacific and North Atlantic which together saw 67% of all global hurricane landfalls from 1970 to 2023. The combined landfalls of minor and major hurricanes for these two basins is shown below and there is no trend in either category. Updated from Weinkle et al. 2012. Below is the same data, but starting from 1970, and you can clearly see that major hurricane landfalls increase over this shorter period, in contrast to beginning the analysis in 1950, when data for these two basins is first available. Updated from Weinkle et al. 2012. In technical terms, detection of change has not been achieved — which is fully consistent with the scientific consensus of NOAA and the IPCC. Without detection there can be no attribution under the IPCC framework for detection and attribution. Given the large interannual and decadal variability in tropical cyclones, data are easily cherrypicked (intentionally or unintentionally) to identify spurious trends. The figures below show the distribution of global landfalling storm counts for major and total hurricanes for the period 1970 to 2023, showing large variability. Updated from Weinkle et al. 2012. Landfalling hurricanes are of course just a subset of tropical cyclones, as many storms stay out to sea. Ryan has just updated his excellent figures on global tropical cyclone activity. The figure below shows running 12-month sums of all hurricanes and major hurricanes since 1980. … Finally, from the excellent data maintained by Phil Klotzbach at Colorado State University, we can look at yet another set of metrics — Accumulated Cyclone Energy (ACE, which combines frequency and intensity) and ACE per hurricane. These figures are shown below, and you can clearly see no trends in these metrics since 1980. Over this time period and according to these metrics, hurricanes have not become more intense. Source: CSU. The final bar is the 1970-2023 average. For full article go to: https://rogerpielkejr.substack.com/p/global-tropical-cyclones

Wrong, ABC News, Data Refutes Strengthening Hurricanes Claim

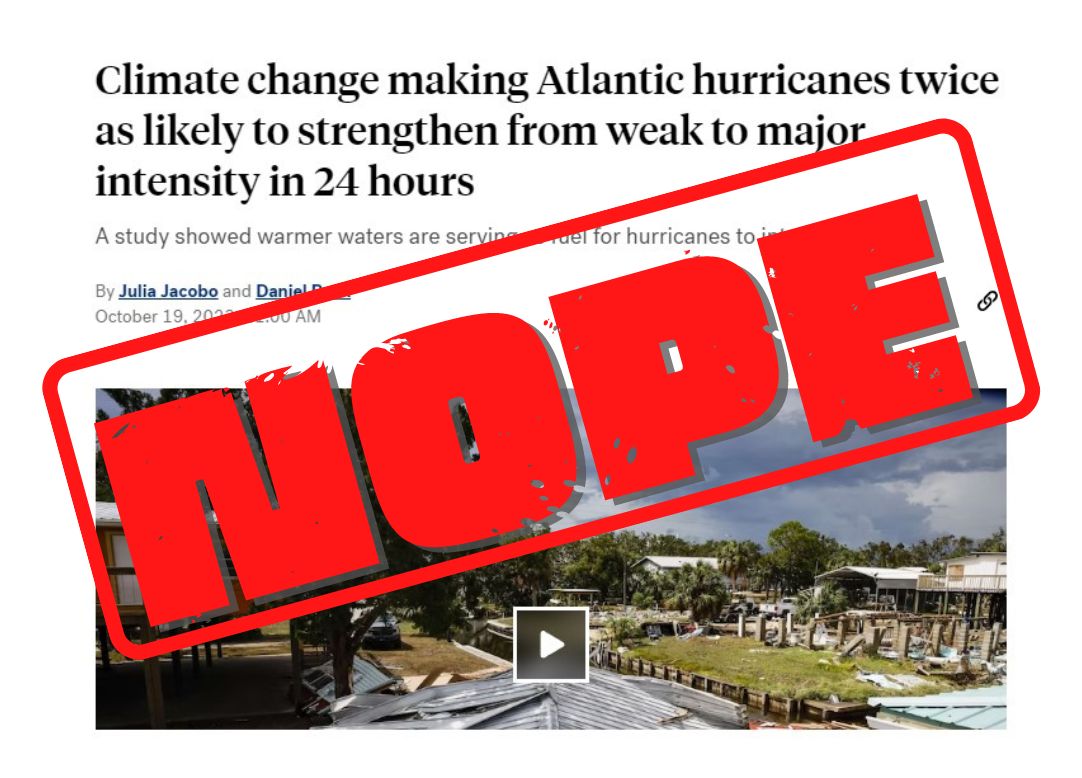
https://climaterealism.com/2023/10/wrong-abc-news-data-refutes-strengthening-hurricanes-claim/ By H. Sterling Burnett The mainstream media, among them ABC News, Reuters and the New York Times, ran prominent stories claiming new research shows that Atlantic hurricanes have now become much more likely to strengthen into powerful hurricanes in a short period of time than in the past due to climate change. This is false. Whatever factors the studies researchers say are making powerful hurricanes more likely to quickly form, must be being counteracted by other factors because data shows that powerful hurricanes are actually on the decline. As ABC News reports in an article, titled “Climate change making Atlantic hurricanes twice as likely to strengthen from weak to major intensity in 24 hours,” a new study in Science Direct claims warming oceans are making rapid powerful hurricane formation more likely to form. “Tropical cyclones in the Atlantic basin may now be more than twice as likely to strengthen from a weak hurricane or tropical storm into a major hurricane in just 24 hours due to climate change and warming waters, a new study suggests,” says ABC News. “Hurricanes are also now more likely to strengthen more rapidly along the East Coast of the U.S. than they were between 1971 and 1990, the paper, published Thursday in Scientific Reports found.” Warm ocean temperatures are a necessary, but not a sufficient factor for hurricane formation. Data indicate, regardless of ocean heating, hurricanes have not formed more frequently during the period of the study or since, and powerful hurricanes, Category 3 and above, have actually declined over the periods of comparison. As a result, even if warming oceans make the rapid formation of powerful hurricanes more likely, confounding factors, evidently not accounted for in the study, have been suppressing the actual formation of powerful hurricanes. Data presented in more than 100 previous Climate Realism posts, here, here, here, and here, for example, clearly show that hurricane trends are relatively flat over the past 50 years of modest warming, and the trend in powerful Atlantic hurricanes is downward (see the figures below) Figure 1: Global Hurricane Frequency (all & major) — 12-month running sums. The top time series is the number of global tropical cyclones that reached at least hurricane-force (maximum lifetime wind speed exceeds 64-knots). The bottom time series is the number of global tropical cyclones that reached major hurricane strength (96-knots+). Adapted from Maue (2011) GRL. https://climatlas.com/tropical/ Figure 2: Figure: Last 50-years+ of Global and Northern Hemisphere Accumulated Cyclone Energy: 24 month running sums. Note that the year indicated represents the value of ACE through the previous 24-months for the Northern Hemisphere (bottom line/gray boxes) and the entire global (top line/blue boxes). The area in between represents the Southern Hemisphere total ACE. https://climatlas.com/tropical/ In point of fact, as discussed in Climate at a Glance: Hurricanes, even the U.N. Intergovernmental Panel on Climate Change (IPCC) admits to finding no increase in the frequency or severity of hurricanes. Also, the United States recently went through its longest period in recorded history without a major hurricane strike, and recently experienced its fewest total hurricanes in any eight-year period. And what’s true for the Atlantic hurricane basin is true for the other major hurricane basins as well. There has been no increase in the number or intensity of tropical cyclones since 1972 as the planet has modestly warmed. Indeed, for some basins the data suggests tropical cyclone frequency has actually declined over the past century. What do the scientists mean when they say conditions are making it “more likely” or “twice as likely” for powerful hurricanes to form, when fewer powerful hurricanes are, in fact, forming? It’s like a casino claiming they’ve made it more likely than ever for gamblers to win, even as casino goers lose greater amounts more frequently: quite frankly, the claims and the facts just don’t line up. One might think, considering the IPCC’s pronouncements about finding no evidence human caused warming is causing an increase in hurricane numbers or severity and the copious publicly available data which underpins the IPCC’s assessment, the media might finally get the hint on hurricanes. Journalists should display a bit more skepticism concerning the latest novel, unverified study claiming hurricanes are getting worse due to global warming. Sadly, this is not the case. The media follows the narrative that purported human caused climate change is causing worsening weather, in this case hurricanes, regardless of facts demonstrating otherwise. For the mainstream media with regard to climate change, their motto seems to be, “damn the facts, full speed ahead with the climate crisis narrative.”

Wrong, ABC News, Data Refutes Strengthening Hurricanes Claim

https://climaterealism.com/2023/10/wrong-abc-news-data-refutes-strengthening-hurricanes-claim/ By H. Sterling Burnett The mainstream media, among them ABC News, Reuters and the New York Times, ran prominent stories claiming new research shows that Atlantic hurricanes have now become much more likely to strengthen into powerful hurricanes in a short period of time than in the past due to climate change. This is false. Whatever factors the studies researchers say are making powerful hurricanes more likely to quickly form, must be being counteracted by other factors because data shows that powerful hurricanes are actually on the decline. As ABC News reports in an article, titled “Climate change making Atlantic hurricanes twice as likely to strengthen from weak to major intensity in 24 hours,” a new study in Science Direct claims warming oceans are making rapid powerful hurricane formation more likely to form. “Tropical cyclones in the Atlantic basin may now be more than twice as likely to strengthen from a weak hurricane or tropical storm into a major hurricane in just 24 hours due to climate change and warming waters, a new study suggests,” says ABC News. “Hurricanes are also now more likely to strengthen more rapidly along the East Coast of the U.S. than they were between 1971 and 1990, the paper, published Thursday in Scientific Reports found.” Warm ocean temperatures are a necessary, but not a sufficient factor for hurricane formation. Data indicate, regardless of ocean heating, hurricanes have not formed more frequently during the period of the study or since, and powerful hurricanes, Category 3 and above, have actually declined over the periods of comparison. As a result, even if warming oceans make the rapid formation of powerful hurricanes more likely, confounding factors, evidently not accounted for in the study, have been suppressing the actual formation of powerful hurricanes. Data presented in more than 100 previous Climate Realism posts, here, here, here, and here, for example, clearly show that hurricane trends are relatively flat over the past 50 years of modest warming, and the trend in powerful Atlantic hurricanes is downward (see the figures below) Figure 1: Global Hurricane Frequency (all & major) — 12-month running sums. The top time series is the number of global tropical cyclones that reached at least hurricane-force (maximum lifetime wind speed exceeds 64-knots). The bottom time series is the number of global tropical cyclones that reached major hurricane strength (96-knots+). Adapted from Maue (2011) GRL. https://climatlas.com/tropical/ Figure 2: Figure: Last 50-years+ of Global and Northern Hemisphere Accumulated Cyclone Energy: 24 month running sums. Note that the year indicated represents the value of ACE through the previous 24-months for the Northern Hemisphere (bottom line/gray boxes) and the entire global (top line/blue boxes). The area in between represents the Southern Hemisphere total ACE. https://climatlas.com/tropical/ In point of fact, as discussed in Climate at a Glance: Hurricanes, even the U.N. Intergovernmental Panel on Climate Change (IPCC) admits to finding no increase in the frequency or severity of hurricanes. Also, the United States recently went through its longest period in recorded history without a major hurricane strike, and recently experienced its fewest total hurricanes in any eight-year period. And what’s true for the Atlantic hurricane basin is true for the other major hurricane basins as well. There has been no increase in the number or intensity of tropical cyclones since 1972 as the planet has modestly warmed. Indeed, for some basins the data suggests tropical cyclone frequency has actually declined over the past century. What do the scientists mean when they say conditions are making it “more likely” or “twice as likely” for powerful hurricanes to form, when fewer powerful hurricanes are, in fact, forming? It’s like a casino claiming they’ve made it more likely than ever for gamblers to win, even as casino goers lose greater amounts more frequently: quite frankly, the claims and the facts just don’t line up. One might think, considering the IPCC’s pronouncements about finding no evidence human caused warming is causing an increase in hurricane numbers or severity and the copious publicly available data which underpins the IPCC’s assessment, the media might finally get the hint on hurricanes. Journalists should display a bit more skepticism concerning the latest novel, unverified study claiming hurricanes are getting worse due to global warming. Sadly, this is not the case. The media follows the narrative that purported human caused climate change is causing worsening weather, in this case hurricanes, regardless of facts demonstrating otherwise. For the mainstream media with regard to climate change, their motto seems to be, “damn the facts, full speed ahead with the climate crisis narrative.” Share Facebook H. Sterling Burnett H. Sterling Burnett, Ph.D., is the Director of the Arthur B. Robinson Center on Climate and Environmental Policy and the managing editor of Environment & Climate News. In addition to directing The Heartland Institute’s Arthur B. Robinson Center on Climate and Environmental Policy, Burett puts Environment & Climate News together, is the editor of Heartland’s Climate Change Weekly email, and the host of the Environment & Climate News Podcast.

Hurricane Idalia is NOT ‘unprecedented’: ‘No different to dozens of other hurricanes which have hit USA in past’ – Similar to at least 46 other US landfalling hurricanes’ – Only ‘unprecedented’ for landfall in that small 50 mile stretch of coastline

Climate analyist Paul Homewood: “Hurricane Idalia made landfall as a Cat 3. There have been 46 other US landfalling hurricanes with 949 MB (millibar) and lower. The bottom line is that Idalia was no different to dozens of other hurricanes which have hit the US in the past.
The media is claiming that “Idalia is the strongest hurricane to strike the Big Bend area – especially near Cedar Key – in 125 years, dating back to an unnamed 1896 storm. That stretch of coastline is, of course, tiny, about 50 or so miles long.” 

2023 Edition: What the media won’t tell you about . . . hurricanes – The science and data reporters refuse to report – Dr. Roger Pielke Jr.

https://rogerpielkejr.substack.com/p/2023-update-what-the-media-wont-tell 2023 Edition: What the media won’t tell you about . . . hurricanes – The science and data reporters refuse to report By ROGER PIELKE JR. Below are five important conclusions from the scientific literature that are rarely, if ever, found in coverage of hurricanes. 1. The scientific consensus on hurricanes and climate change is clear and consistent. In short —trends in hurricane activity outside the range of documented variability have not been detected, nor is there high confidence in connections of hurricane behavior to greenhouse gas emissions. Don’t take it from me. Here is what the National Oceanic and Atmospheric Administration (NOAA) said this month: [F]or Atlantic hurricane activity, the attribution observed changes to increasing greenhouse gases is not yet assessed as highly confident, apart from impacts related to sea level rise. Observed hurricane data generally either do not show clear centennial-scale trends or do not cover enough years to assess century-scale trends. Pronounced multidecadal variations typically dominate over long-term (centennial-scale) trends over decadal timescales for Atlantic hurricanes. NOAA’s assessment of scientific understandings is consistent with that of the most recent assessment of Intergovernmental Panel on Climate Change (IPCC): [T]here is still no consensus on the relative magnitude of human and natural influences on past changes in Atlantic hurricane activity, and particularly on which factor has dominated the observed increase (Ting et al., 2015) and it remains uncertain whether past changes in Atlantic TC activity are outside the range of natural variability. There are hypothesized effects — such as the rapid intensification of storms or enhanced precipitation — but NOAA concludes that “confident quantitative attribution” of changes in the phenomena to greenhouse gas emissions or internal variability “remains an unsettled topic of research.” The media often conflates hypotheses with firmly established conclusions. NOAA further states: “an anthropogenic influence has not been formally detected specifically for hurricane-related precipitation” For storm numbers, rapid intensification probability and extreme precipitation, “climate change detection/attribution studies are not yet definitive for hurricane activity metrics, and more research is needed for more confident conclusions.” “it is premature to conclude with high confidence that human-caused increases in greenhouse gases have caused a change in past Atlantic basin hurricane activity that is outside the range of natural variability” There is little ambiguity in the current state of the science of hurricanes and climate change. Share 2. Hurricane landfalls along the continental U.S. show no trends since at least 1900. Here are all landfalling U.S. hurricanes since 1900. Here are all landfalling major hurricanes since 1900. I’ve not seen either dataset appear in the legacy media — well, except once, when Bill Nye “The Science Guy” printed out my graph and took a sharpie to it on CNN, apparently to “correct” the data to show an increase! How to turn “No INcrease” into an “Increase” — Use a Sharpie! Share 3. Development and growth are sufficient to explain why hurricane damage has increased dramatically Spot the change While climate change is typically the focus of attention when hurricanes make landfall, there is no debate that the single biggest factor driving increasing damage from storms is development — the growth of buildings and amount of wealth exposed to storms. As blindingly obvious as this may seem, it is routinely ignored in the promotion of NOAA’s “billion dollar disaster” campaign. For more than 25 years, my colleagues and I have estimated how much damage that storms of the past would cause if they occurred with contemporary levels of development. Our methods offer a useful independent estimate of such losses that can be compared to the results of catastrophe models. … 4. Climate change is important, but far more important for understanding trends and causes of increasing disaster costs is societal change, especially what we build, where we build and how we build. It is not just hurricanes. Damage associated with extreme weather events has increased dramatically in recent decades. The reason? More people with more stuff. The map and graph below show population increases in different regions of the United States. We like to live where risks are high — in particular, East and Gulf Coasts (hurricanes) and California (fires and earthquakes). Source: Klotzbach et al. 2018 … 5. The largest climate signal — by far — in the damage record of U.S. hurricanes is ENSO. There are only a few times in my career when I can say that I actually discovered something fundamentally new. Once was in the 1990s when, along with Chris Landsea, we discovered a very strong signal in U.S. hurricane damage based on the phases of the El Niño/Southern Oscillation or ENSO. In a nutshell, during the peak of the hurricane season (that is August-October) El Niño conditions have the fewest landfalls and damage and La Niña conditions have the most, with neutral years falling in between. You can see this in the figures below. Source: Klotzbach et al. 2018 The panel on the left shows that there are almost twice as many hurricane landfalls in La Niña years compared to El Niño years. The panel on the right shows an even larger difference in median damage. But be careful — these are summary statistics with considerable variation and damaging storms can happen in any phase of ENSO.

Physicist: ‘The frequency & severity of floods, droughts, hurricanes, tornadoes, heat waves & wildfires are not increasing, & may even be declining in some cases’

https://www.scienceunderattack.com/blog/2023/5/15/no-evidence-that-extreme-weather-on-the-rise-a-look-at-the-past-1-hurricanes-129 By Physicist Dr. Ralph Alexander The popular but mistaken belief that today’s weather extremes are more common and more intense because of climate change is becoming deeply embedded in the public consciousness, thanks to a steady drumbeat of articles in the mainstream media and pronouncements by luminaries such as President Biden in the U.S., Pope Francis and the UN Secretary-General. But the belief is wrong and more a perception than reality. An abundance of scientific evidence demonstrates that the frequency and severity of floods, droughts, hurricanes, tornadoes, heat waves and wildfires are not increasing, and may even be declining in some cases. That so many people think otherwise reflects an ignorance of, or an unwillingness to look at, our past climate. Collective memories of extreme weather are short-lived. In this and subsequent posts, I’ll present examples of extreme weather over the past century or so that matched or exceeded anything we’re experiencing in the present-day world. I’ll start with hurricanes. The deadliest U.S. hurricane in record­ed history struck Galveston, Texas in 1900, killing an estimated 8,000 to 12,000 people. Lacking a protective seawall built later, the thriving port was completely flattened (photo on right) by winds of 225 km per hour (140 mph) and a storm surge exceeding 4.6 meters (15 feet). With almost no automobiles, the hapless populace could flee only on foot or by horse and buggy. Reported the Nevada Daily Mail at the time: Residents [were] crushed to death in crumbling buildings or drowned in the angry waters. Hurricanes have been a fact of life for Americans in and around the Gulf of Mexico since Galveston and before. The death toll has come down over time with improvements in planning and engineering to safeguard structures, and the development of early warning sys­tems to allow evacuation of threatened communities. Nevertheless, the frequency of North Atlantic hurricanes has been essentially unchanged since 1851, as seen in the following figure. The apparent heightened hurricane ac­tivity over the last 20 years, particularly in 2005 and 2020, simply reflects improvements in observational capabilities since 1970 and is unlikely to be a true climate trend, say a team of hurricane experts. As you can see, the incidence of major North Atlantic hurricanes in recent decades is no higher than that in the 1950s and 1960s. Ironically, the earth was actually cooling during that period, unlike today. Of notable hurricanes during the active 1950s and 1960s, the deadliest was 1963’s Hurricane Flora that cost nearly as many lives as the Galveston Hurricane. Flora didn’t strike the U.S. but made successive landfalls in Tobago, Haiti and Cuba (path shown in photo on left), reaching peak wind speeds of 320 km per hour (200 mph). In Haiti a record 1,450 mm (57 inches) of rain fell – comparable to what Hurricane Harvey dumped on Houston in 2017 – resulting in landslides which buried whole towns and destroyed crops. Even heavier rain, up to 2,550 mm (100 inches), devastated Cuba and 50,000 people were evacuated from the island, according to the Sydney Morning Herald. Hurricane Diane in 1955 walloped the North Carolina coast, then moved north through Virginia and Pennsylvania before ending its life as a tropical storm off the coast of New England. Although its winds had dropped from 190 km per hour (120 mph) to less than 55 km per hour (35 mph) by then, it spawned rainfall of 50 cm (20 inches) over a two-day period there, causing massive flooding and dam failures (photo to right). An estimated total of 200 people died. In North Carolina, Diane was but one of three hurricanes that struck the coast in just two successive months that year. In 1960, Hurricane Donna moved through Florida with peak wind speeds of 285 km per hour (175 mph) after pummeling the Bahamas and Puerto Rico. A storm surge of up to 4 meters (13 feet) combined with heavy rainfall caused extensive flooding all across the peninsula (photo on left). On leaving Florida, Donna struck North Carolina, still as a Category 3 hurricane (top wind speed 180 km per hour or 110 mph), and finally Long Island and New England. NOAA (the U.S. National Oceanic and Atmospheric Administration) calls Donna “one of the all-time great hurricanes.” Florida has been a favorite target of hurricanes for more than a century. The next figure depicts the frequency by decade of all Florida landfalling hurricanes and major hurricanes (Category 3, 4 or 5) since the 1850s. While major Florida hurricanes show no trend over 170 years, the trend in hurricanes overall is downward – even in a warming world. Hurricane Camille in 1969 first made landfall in Cuba, leaving 20,000 people homeless. It then picked up speed, smashing into Mississippi as a Category 5 hurricane with wind speeds of approximately 300 km per hour (185 mph); the exact speed is unknown because the hurricane’s impact destroyed all measuring instruments. Camille generated waves in the Gulf of Mexico over 21 meters (70 feet) high, beaching two ships (photo on right), and caused the Mississippi River to flow backwards. A total of 257 people lost their lives, the Montreal Gazette reporting that workers found: a ton of bodies … in trees, under roofs, in bushes, everywhere. These are just a handful of hurricanes from our past, all as massive and deadly as last year’s Category 5 Hurricane Ian which deluged Florida with a storm surge as high as Galveston’s and rainfall up to 685 mm (27 inches); 156 were killed. Hurricanes are not on the rise today.

No Evidence That Extreme Weather on the Rise: A Look at the Past – Hurricanes

https://www.scienceunderattack.com/blog/2023/5/15/no-evidence-that-extreme-weather-on-the-rise-a-look-at-the-past-1-hurricanes-129 By Physicist Dr. Ralph B. Alexander The popular but mistaken belief that today’s weather extremes are more common and more intense because of climate change is becoming deeply embedded in the public consciousness, thanks to a steady drumbeat of articles in the mainstream media and pronouncements by luminaries such as President Biden in the U.S., Pope Francis and the UN Secretary-General. But the belief is wrong and more a perception than reality. An abundance of scientific evidence demonstrates that the frequency and severity of floods, droughts, hurricanes, tornadoes, heat waves and wildfires are not increasing, and may even be declining in some cases. That so many people think otherwise reflects an ignorance of, or an unwillingness to look at, our past climate. Collective memories of extreme weather are short-lived. In this and subsequent posts, I’ll present examples of extreme weather over the past century or so that matched or exceeded anything we’re experiencing in the present-day world. I’ll start with hurricanes. The deadliest U.S. hurricane in record­ed history struck Galveston, Texas in 1900, killing an estimated 8,000 to 12,000 people. Lacking a protective seawall built later, the thriving port was completely flattened (photo on right) by winds of 225 km per hour (140 mph) and a storm surge exceeding 4.6 meters (15 feet). With almost no automobiles, the hapless populace could flee only on foot or by horse and buggy. Reported the Nevada Daily Mail at the time: Residents [were] crushed to death in crumbling buildings or drowned in the angry waters. Hurricanes have been a fact of life for Americans in and around the Gulf of Mexico since Galveston and before. The death toll has come down over time with improvements in planning and engineering to safeguard structures, and the development of early warning sys­tems to allow evacuation of threatened communities. Nevertheless, the frequency of North Atlantic hurricanes has been essentially unchanged since 1851, as seen in the following figure. The apparent heightened hurricane ac­tivity over the last 20 years, particularly in 2005 and 2020, simply reflects improvements in observational capabilities since 1970 and is unlikely to be a true climate trend, say a team of hurricane experts. As you can see, the incidence of major North Atlantic hurricanes in recent decades is no higher than that in the 1950s and 1960s. Ironically, the earth was actually cooling during that period, unlike today. Of notable hurricanes during the active 1950s and 1960s, the deadliest was 1963’s Hurricane Flora that cost nearly as many lives as the Galveston Hurricane. Flora didn’t strike the U.S. but made successive landfalls in Tobago, Haiti and Cuba (path shown in photo on left), reaching peak wind speeds of 320 km per hour (200 mph). In Haiti a record 1,450 mm (57 inches) of rain fell – comparable to what Hurricane Harvey dumped on Houston in 2017 – resulting in landslides which buried whole towns and destroyed crops. Even heavier rain, up to 2,550 mm (100 inches), devastated Cuba and 50,000 people were evacuated from the island, according to the Sydney Morning Herald. Hurricane Diane in 1955 walloped the North Carolina coast, then moved north through Virginia and Pennsylvania before ending its life as a tropical storm off the coast of New England. Although its winds had dropped from 190 km per hour (120 mph) to less than 55 km per hour (35 mph) by then, it spawned rainfall of 50 cm (20 inches) over a two-day period there, causing massive flooding and dam failures (photo to right). An estimated total of 200 people died. In North Carolina, Diane was but one of three hurricanes that struck the coast in just two successive months that year. In 1960, Hurricane Donna moved through Florida with peak wind speeds of 285 km per hour (175 mph) after pummeling the Bahamas and Puerto Rico. A storm surge of up to 4 meters (13 feet) combined with heavy rainfall caused extensive flooding all across the peninsula (photo on left). On leaving Florida, Donna struck North Carolina, still as a Category 3 hurricane (top wind speed 180 km per hour or 110 mph), and finally Long Island and New England. NOAA (the U.S. National Oceanic and Atmospheric Administration) calls Donna “one of the all-time great hurricanes.” Florida has been a favorite target of hurricanes for more than a century. The next figure depicts the frequency by decade of all Florida landfalling hurricanes and major hurricanes (Category 3, 4 or 5) since the 1850s. While major Florida hurricanes show no trend over 170 years, the trend in hurricanes overall is downward – even in a warming world. Hurricane Camille in 1969 first made landfall in Cuba, leaving 20,000 people homeless. It then picked up speed, smashing into Mississippi as a Category 5 hurricane with wind speeds of approximately 300 km per hour (185 mph); the exact speed is unknown because the hurricane’s impact destroyed all measuring instruments. Camille generated waves in the Gulf of Mexico over 21 meters (70 feet) high, beaching two ships (photo on right), and caused the Mississippi River to flow backwards. A total of 257 people lost their lives, the Montreal Gazette reporting that workers found: a ton of bodies … in trees, under roofs, in bushes, everywhere. These are just a handful of hurricanes from our past, all as massive and deadly as last year’s Category 5 Hurricane Ian which deluged Florida with a storm surge as high as Galveston’s and rainfall up to 685 mm (27 inches); 156 were killed. Hurricanes are not on the rise today.

New York moves to become 1st state banning natural gas hookups – Gov. Hochul: ‘Everyone knows we’ve seen the effects of climate change —the storms, the hurricanes coming to NY, record snow amounts. We’re seeing the effects every single day’

https://www.foxnews.com/politics/new-york-moves-become-first-state-banning-natural-gas-hookups By Thomas Catenacci | Fox News ‘Our budget prioritizes nation-leading climate action that meets this moment,’ Democratic Gov Hochul said New York state leaders led by Democratic Gov. Kathy Hochul reached an agreement late Thursday on the state’s 2024 budget which includes a future ban on natural gas hookups in new building construction. Under the budget deal, natural gas hookups will be banned in small buildings beginning in 2025 and large buildings beginning in 2028, according to Hochul. The governor said in remarks that the budget insulates households from “exorbitant energy bills” while helping the state build a “more sustainable future.” “Everyone knows we’ve seen the effects of climate change — the storms, the hurricanes coming to New York, record snow amounts. We’re seeing the effects every single day. Not just here, but across the nation,” Hochul told reporters. “Our budget prioritizes nation-leading climate action that meets this moment with ambition and the commitment it demands.” “We’re going to be the first state in the nation to advance zero-emission new homes and buildings beginning in 2025 for small buildings, 2028 for large buildings,” she continued. “And we have more to do.” “We’re going to be the first state in the nation to advance zero-emission new homes and buildings,” New York Gov. Kathy Hochul said Thursday evening. (AP Photo/Hans Pennink) In addition, the budget will expand the New York Power Authority’s authority over renewable energy development and fossil fuel power shutdowns. Both the New York Power Authority and New York Independent System Operator have warned such a proposal could be detrimental to the state’s electric grid. “I promised New Yorkers we’d make our state more affordable, more livable and safer, and this budget delivers on that promise,” Hochul added in a statement. “I am pleased to have reached an agreement with Speaker Heastie and Leader Stewart-Cousins on a transformative budget that improves public safety, transforms our mental health care system, protects our climate and invests in our children’s future,” she said. While the budget would make New York the first state to pursue a statewide natural gas hookup ban, several Democratic-led cities including New York City have already implemented gas appliance restrictions while some states like California have tackled the issue through modified building codes. Berkeley, California, became the first jurisdiction to implement such a ban in 2019. However, a federal appeals panel recently ruled that the city’s ban violated the federal Energy Policy and Conservation Act of 1975 in a potential blow to similar laws across the country. Overall, in 2021, about 60% of all New York households relied on natural gas for heating while another 20% used heating oil, according to the Energy Information Administration. Additionally, just 14% of households in the state were heated with electricity, the vast majority of which was generated by natural gas power plants. In 2021, about 60% of all New York households relied on natural gas for heating while another 20% used heating oil, according to the Energy Information Administration. (Jakub Porzycki/NurPhoto via Getty Images) “At the precipice of global climate disaster, it’s long past time to stop building new buildings that burn fossil fuels for heat and hot water,” a coalition of environmental groups led by Earthjustice said in a joint statement Friday morning. “Building all-electric will save New Yorkers money on energy bills, reduce climate-heating pollution, create jobs in clean energy, and reduce childhood asthma, a win-win for New Yorkers. It is also politically popular, with New Yorkers overwhelmingly in support,” it continued. The coalition — which also included Food & Water Watch, New York Communities for Change and New York Public Interest Research Group — said, on its face, the budget “will be an enormous victory.” But the coalition also warned the details are not yet known and urged leaders to “set this historic win into place as the nation’s first state law ending gas in new construction.” “New Yorkers are watching carefully to make sure the final budget includes real action and doesn’t defer to the gas lobby. New Yorkers don’t want a big announcement that turns out to be a sham,” the groups added. I am old enough to remember back in Jan 2023 when bans on natural gas were only a conspiracy theory. No One Is Coming for Your Gas Stove Anytime Soon – The New York Times – https://t.co/hdz6XyVx91 https://t.co/qRUeFSdyVF pic.twitter.com/NmBze0xaO6 — Marc Morano (@ClimateDepot) April 28, 2023

Definitive Guide to Extreme Weather: No trends or declining trends in hurricanes, floods, tornadoes, droughts, heat waves, disaster losses, wildfires – All peer-reviewed & official sources – By Dr. Roger Pielke Jr.

https://threadreaderapp.com/thread/1625530996958572545.html The Honest Broker by Roger Pielke Jr.     Feb 14, 2023 • 18 tweets 🧵 What the media won’t tell you about extreme weather and its impactsHere is a thread of some of the figures I’ve posted in recent months about extreme weather that I have never seen in legacy media reportingAll peer-reviewed and official sources . . .  Floods IPCC finds no trends in flooding globally Did you know that flood impacts in the US as a proportion of wealth are down >70% over 80 years? Huge news, good news!But don’t tell anyone 🥸 rogerpielkejr.substack.com/p/series-what-… SERIES: What the media won’t tell you about . . . Floods Let’s take a look at what the IPCC and recent research actually sayshttps://rogerpielkejr.substack.com/p/series-what-the-media-wont-tell-you-3b0 # Drought The IPCC finds no long-term trends in meteorological or hydrological drought In Western Europe specifically there is no trend in drought over >150 years rogerpielkejr.substack.com/p/series-what-… SERIES: What the media won’t tell you about . . . Drought in Western and Central Europe Let’s take a look at what the IPCC and recent research actually say https://rogerpielkejr.substack.com/p/series-what-the-media-wont-tell-you # US heat waves The US government’s official metric for heat waves comes from a paper I co-authored more than 20 years ago. It shows an increase since ~1960s but a decrease since <1930s rogerpielkejr.substack.com/p/what-the-med… SERIES: What the media won’t tell you about . . . U.S. heat waves Let’s take a look at what the IPCC and official data really say https://rogerpielkejr.substack.com/p/what-the-media-wont-tell-you-about-9f9 US heat waves During the past 50 years, when heat waves have increased, mortality from extreme heat has fallen pretty much everywhere in the US rogerpielkejr.substack.com/p/what-the-med…That is good news! Let’s keep it up SERIES: What the media won’t tell you about . . . U.S. heat waves Let’s take a look at what the IPCC and official data really say https://rogerpielkejr.substack.com/p/what-the-media-wont-tell-you-about-9f9 # US (mainland) hurricanes IPCC, WMO, UNNCA are all in agreement No upwards trends in landfalling hurricanes, including the strongest storms. Have you ever seen these graphs in the media (aside from Bill Nye and his sharpie;) rogerpielkejr.substack.com/p/what-the-med… SERIES: What the media won’t tell you about . . . hurricanes Let’s take a look at what the IPCC and official data really sayhttps://rogerpielkejr.substack.com/p/what-the-media-wont-tell-you-about # US disaster costs As a proportion of GDP US disaster costs have gone down More good news! rogerpielkejr.substack.com/p/billion-doll… “Billion Dollar Disasters” are a National EmbarrassmentYou won’t find a more obvious example of bad science from the U.S. governmenthttps://rogerpielkejr.substack.com/p/billion-dollar-disasters-are-a-national European disaster costs As a proportion of GDP European disaster losses have gone down Even more good news! rogerpielkejr.substack.com/p/making-sense… SERIES: Making Sense of Trends in Disaster Losses Part 2: Normalized disaster losses in Europe 1995 to 2019https://rogerpielkejr.substack.com/p/making-sense-of-trends-in-disaster-ced Global weather and climate disaster losses As a proportion of GDP global disaster (weather and climate, but also overall) have gone down Great news! rogerpielkejr.substack.com/p/dont-believe… Don’t Believe the Hype Global Disasters in 2022, a Preliminary Assessment https://rogerpielkejr.substack.com/p/dont-believe-the-hype Disasters This century the number of disasters tracked by EM-DAT has not increased, in fact down a bit Important to understand why so that progress with respect to the Sendai Framework can be maintained! rogerpielkejr.substack.com/p/dont-believe… ] Don’t Believe the Hype Global Disasters in 2022, a Preliminary Assessmenthttps://rogerpielkejr.substack.com/p/dont-believe-the-hype # US tornadoes Reports of the strongest US tornadoes (EF3+) which cause ~70% of death and destruction are down in the long and short terms rogerpielkejr.substack.com/p/what-the-med… What the media won’t tell you about . . . Tornadoes Let’s take a look at what the data and science actually say https://rogerpielkejr.substack.com/p/what-the-media-wont-tell-you-about-3fe Damage from tornadoes supports the data on falling numbers of the strongest tornadoes Both inflation-adjusted and normalized tornado losses have decreased rogerpielkejr.substack.com/p/what-the-med… What the media won’t tell you about . . . Tornadoes Let’s take a look at what the data and science actually say https://rogerpielkejr.substack.com/p/what-the-media-wont-tell-you-about-3fe Normalized US hurricane losses As we would expect with no up-trend in US landfalls there is no trend in normalized US hurricane losses since 1900 rogerpielkejr.substack.com/p/pielkes-week… Pielke’s Weekly Memo #19A sneak peak at normalized U.S. hurricane losses 1900 to 2022 https://rogerpielkejr.substack.com/p/pielkes-weekly-memo-19 Global hurricane landfalls Lots of ups and downs over 70+ years but no overall trend rogerpielkejr.substack.com/p/just-the-fac… Just the Facts on Global HurricanesMore storms? Fewer but more intense? More landfalls? No, No and Nohttps://rogerpielkejr.substack.com/p/just-the-facts-on-global-hurricanes Global hurricane energy More ups and down but no trend since 1980 rogerpielkejr.substack.com/p/just-the-fac… Just the Facts on Global Hurricanes More storms? Fewer but more intense? More landfalls? No, No and No https://rogerpielkejr.substack.com/p/just-the-facts-on-global-hurricanes Global hurricane energy per storm No trend since 1980 Storms are not getting stronger but fewerrogerpielkejr.substack.com/p/just-the-fac… Just the Facts on Global HurricanesMore storms? Fewer but more intense? More landfalls? No, No and Nohttps://rogerpielkejr.substack.com/p/just-the-facts-on-global-hurricanes Everything you find in this thread Everything Is consistent with what has been reported in the IPCC & found in official data and the peer-reviewed literatureShhh … don’t tell anyone How to Understand the New IPCC Report: Part 2, Extreme Events Contrary to what you’ve been reading, the massive new IPCC report offers grounds for optimism on climate science and policyhttps://rogerpielkejr.substack.com/p/how-to-understand-the-new-ipcc-report-1e3 If you want to understand what the science of extreme weather, climate and disasters actually says, please sign up to The Honest Broker Amazing to me that some of the things I write about you cannot find anywhere else So I’m not gonna stop

For more results click below