Cutting emissions 44% by 2030 would mean an average loss of more than 1.2 million jobs ‼️
— Heritage Foundation (@Heritage) August 2, 2022
KEY TAKEAWAYS
The Biden Administration’s climate goals are so unrealistic that the Heritage Energy Model—a clone of the EIA’s model—crashes before they can be achieved.
Attempting to meet these goals through a carbon tax would reduce U.S. GDP by $7.7 trillion over 18 years and U.S. employment by 1.2 million jobs.
Eliminating all U.S. emissions would reduce global temperatures by less than 0.2 degrees Celsius by 2100—wrecking the economy for a negligible climate benefit.
One of President Joe Biden’s first actions in office was to recommit the United States to the Paris Agreement on global warming. The international accord aims to keep global warming below 2 degrees Celsius from preindustrial levels, with the ultimate objective of limiting warming to 1.5 degrees Celsius.1
Presidential Documents, Executive Order 14008 of January 27, 2021, “Tackling the Climate Crisis at Home and Abroad,” Federal Register, Vol. 86, No. 19 (February 1, 2021), pp. 7619–7633, https://www.federalregister.gov/documents/2021/02/01/2021-02177/tackling-the-climate-crisis-at-home-and-abroad (accessed April 28, 2022), and United Nations Framework Convention on Climate Change, “Paris Agreement,” November 4, 2016, https://unfccc.int/files/meetings/paris_nov_2015/application/pdf/paris_agreement_english_.pdf (accessed April 27, 2022).
While the Paris Agreement’s climate impact will be minimal at best (even when assuming that the signatory countries follow through on their commitments), the policies implemented by the Biden Administration to reach its intended targets will impose significant costs on American families and businesses. Americans are struggling under high inflation, exacerbated by record-high energy prices. Prohibiting and restricting the use of natural resources while subsidizing and mandating alternatives will only further increase energy costs. This is perhaps the greatest weakness of the Paris Agreement—while rejecting resources that meet most of the world’s energy needs, the Paris Agreement has yet to address the growing energy needs around the world. Energy is essential to peoples’ health, well-being, and economic opportunity and has been a key driver in the dramatic decrease in mortality and extreme poverty over the past century.
To estimate and better understand these broader economic costs, we (the authors of this Backgrounder) modeled a theoretically efficient carbon tax designed to achieve the Biden Administration’s emissions reduction targets. The Administration’s approach is likely to be a less efficient, politically expedient set of policies.
Even with theoretical efficiency, we find the costs of the policy to be staggering. The economy would, in aggregate, lose $7.7 trillion of gross domestic product (GDP) through 2040, which is $87,000 per family of four. The climate impact of these policies pale in comparison to the costs. Even if the U.S. and other Organization for Economic Co-operation and Development (OECD) countries reduced their emissions to zero today, the averted warming would be a meager 0.5 degrees Celsius by the year 2100 according to Heritage Foundation modeling.
Whether or not the other OECD countries join the U.S. in meeting the Paris pledges, little if anything will be achieved in terms of moderating global warming. Meeting the Paris pledges will, however, come at a high cost. President Biden should work with Congress on a policy agenda that rejects symbolic but ineffective climate policies, reduces barriers to innovation and economic opportunity, and protects the environment. U.S. leadership on the international stage should be rooted in economic freedom.
The U.S. and Nationally Determined Contributions
The Paris climate agreement does not set any legally binding requirements on emissions reductions. However, each country must submit a Nationally Determined Contribution (NDC) that outlines what a country will do to reduce greenhouse gas (GHG) emissions and adapt to a changing climate. NDCs are voluntary, non-enforceable, and typically submitted every five years with increasingly ambitious commitments.2
United Nations Framework Convention on Climate Change, “Nationally Determined Contributions (NDCs),” https://unfccc.int/process-and-meetings/the-paris-agreement/nationally-determined-contributions-ndcs/nationally-determined-contributions-ndcs (accessed April 27, 2022).
In April 2021, the Biden Administration submitted a new NDC for the U.S. to reduce GHG emissions by 50 percent to 52 percent below 2005 levels by 2030.3
The White House, “Fact Sheet: President Biden Sets 2030 Greenhouse Gas Pollution Reduction Target Aimed at Creating Good-Paying Union Jobs and Securing U.S. Leadership on Clean Energy Technologies,” April 22, 2021, https://www.whitehouse.gov/briefing-room/statements-releases/2021/04/22/fact-sheet-president-biden-sets-2030-greenhouse-gas-pollution-reduction-target-aimed-at-creating-good-paying-union-jobs-and-securing-u-s-leadership-on-clean-energy-technologies/ (accessed April 27, 2022).
Further, the Administration set a goal of fully decarbonizing the electricity sector by 2035, and to reach economy-wide net-zero emissions by 2050. While the Administration frequently refers to these as “our” goals, Americans’ representatives in Congress have not acceded to them either in the form of the “advice and consent” of the Senate required for a treaty, nor through concurring and supporting legislation and appropriations.
Though other countries, particularly developing ones, have made commitments without legally binding frameworks, America’s targets likely will be binding in practice through domestic laws, regulations, and executive actions. Extreme environmental organizations also are almost certain to sue federal regulatory agencies, states, and private companies to enforce the Biden Administration’s NDC should the U.S. not meet it.4
See, for example, Ben Lefebvre, “Court Invalidates Gulf of Mexico Oil Lease Sale, Citing Faulty Environmental Analysis,” Politico, January 27, 2022, https://subscriber.politicopro.com/article/2022/01/court-invalidates-gulf-of-mexico-oil-lease-sale-citing-faulty-environmental-analysis-pro-00003090 (accessed April 27, 2022).
To date, the federal courts have adopted a variety of responses to the Biden and previous Administrations’ climate-related regulations, granting deference to some regulatory agencies and checking executive action in others.
To achieve a 50 percent to 52 percent reduction in GHG emissions from 2005 levels by 2030, the Biden Administration has embarked on a “whole-of-government” approach to reduce GHG emissions in various aspects of the economy, such as electricity generation, commercial and residential buildings, transportation, industrial processes, and agriculture.5
Presidential Documents, Executive Order 14008, “President Biden Sets 2030 Greenhouse Gas Pollution Reduction Target,” and Presidential Documents, Executive Order 13990 of January 20, 2021, “Protecting Public Health and the Environment and Restoring Science to Tackle the Climate Crisis,” Federal Register, Vol. 86, No. 14 (January 25, 2021), pp. 7037–7043, https://www.federalregister.gov/documents/2021/01/25/2021-01765/protecting-public-health-and-the-environment-and-restoring-science-to-tackle-the-climate-crisis (accessed April 28, 2022).
In addition to directing executive departments and agencies to develop climate adaptation plans,6
Council on Environmental Quality, “Federal Climate Adaptation Plans,” https://www.sustainability.gov/adaptation/ (accessed April 28, 2022).
the Administration has taken many measures to ostensibly limit America’s climate impact, including:
- Revoking the cross-border permit for the Keystone XL Pipeline, which would have delivered up to 830,000 barrels of crude oil per day from Alberta, Canada, to U.S. refineries;7
“Keystone Pipeline Officially Canceled After Biden Revokes Key Permit,” CNBC, June 9, 2021, https://www.cnbc.com/2021/06/09/tc-energy-terminates-keystone-xl-pipeline-project.html (accessed April 28, 2022).
- Prohibiting new oil, coal, and natural gas leases on federal lands and waters;8
Though the U.S. District Court for the Western District of Louisiana issued an injunction in June 2021 requiring the Department of the Interior to hold lease sales, the department is severely restricting access to federal lands and has yet to hold a lease sale. Daren Bakst, ed., “37 Biden Administration Regulations in the Pipeline that Americans Should Know About,” Heritage Foundation Special Report No. 250, December 8, 2021, https://www.heritage.org/sites/default/files/2021-12/SR250.pdf.
- Reinstating Obama-era methane regulations for oil and natural gas production and distribution;9
U.S. Environmental Protection Agency, “EPA Proposes New Source Performance Standards Updates, Emissions Guidelines to Reduce Methane and Other Harmful Pollution from the Oil and Natural Gas Industry,” November 2, 2021, https://www.epa.gov/controlling-air-pollution-oil-and-natural-gas-industry/epa-proposes-new-source-performance (accessed April 28, 2022).
- Reassessing the social cost of carbon dioxide (as well as other GHGs), making it easier for agencies to justify the costs of climate regulations;10
The White House, “A Return to Science: Evidence-Based Estimates of the Benefits of Reducing Climate Pollution,” February 26, 2021, https://www.whitehouse.gov/cea/written-materials/2021/02/26/a-return-to-science-evidence-based-estimates-of-the-benefits-of-reducing-climate-pollution/ (accessed April 27, 2022).
- Promulgating GHG regulations for new light-, medium-, and heavy-duty vehicles with the ultimate goal of phasing out the internal combustion engine;11
U.S. Environmental Protection Agency, “Final Rule to Revise Existing National GHG Emissions Standards for Passenger Cars and Light Trucks Through Model Year 2026,” https://www.epa.gov/regulations-emissions-vehicles-and-engines/proposed-rule-revise-existing-national-ghg-emissions (accessed April 27, 2022), and U.S. Environmental Protection Agency, “Proposed Rule and Related Materials for Control of Air Pollution from New Motor Vehicles: Heavy-Duty Engine and Vehicle Standards,” https://www.epa.gov/regulations-emissions-vehicles-and-engines/proposed-rule-and-related-materials-control-air-1 (accessed April 28, 2022).
- Signing an executive order calling for half of new car sales to be zero-emission vehicles by 2030;12
Presidential Documents, Executive Order 14037 of August 5, 2021, “Strengthening American Leadership in Clean Cars and Trucks,” Federal Register, Vol. 86, No. 151 (August 10, 2021), pp. 43583–43585, https://www.federalregister.gov/documents/2021/08/10/2021-17121/strengthening-american-leadership-in-clean-cars-and-trucks (accessed May 16, 2022).
- Proposing regulations requiring federal pension investment plans to prioritize climate and “environmental, social, and governance” factors over financial security for employees;13
U.S. Department of Labor, “Prudence and Loyalty in Selecting Plan Investments and Exercising Shareholder Rights–Proposed Rule,” https://www.dol.gov/agencies/ebsa/laws-and-regulations/rules-and-regulations/public-comments/1210-AC03 (accessed April 28, 2022).
- Proposing regulations requiring additional disclosure of GHG emissions and “climate risk” by public companies;14
Securities and Exchange Commission, “The Enhancement and Standardization of Climate-Related Disclosures for Investors,” Proposed Rule, Federal Register, Vol. 87, No. 69 (April 11, 2022), pp. 21334–21437, https://www.govinfo.gov/content/pkg/FR-2022-04-11/pdf/2022-06342.pdf (accessed April 28, 2022).
- Proposing dozens of energy efficiency tests and standards for household and commercial-grade products;15
Bakst, “37 Biden Administration Regulations.”
- Banning federal technical assistance to other countries or use of taxpayer-subsidized international finance for oil, coal, and natural gas projects;16
Sara Schonhardt, “Biden to End Fossil Fuel Financing Abroad,” E & E News, December 10, 2021, https://www.eenews.net/articles/biden-to-end-fossil-fuel-financing-abroad/ (accessed April 28, 2022).
and
- Signing an executive order requiring federal procurement of GHG-emissions-free electricity, technologies, and building materials.17
Presidential Documents, Executive Order 14057 of December 8, 2021, “Catalyzing Clean Energy Industries and Jobs Through Federal Sustainability,” Federal Register, Vol. 86, No. 236 (December 13, 2021), pp. 70935–70943, https://www.federalregister.gov/documents/2021/12/13/2021-27114/catalyzing-clean-energy-industries-and-jobs-through-federal-sustainability (accessed May 16, 2022).
Many of these actions fail to consider the unintended consequences. For instance, revoking the permit for the Keystone XL pipeline will likely result in more crude oil delivered by rail or truck or increased Canadian oil exports to other countries, such as China.
Though Congress remains deeply divided on policies to restrict GHG emissions economy-wide, it passed a $1.9 trillion stimulus, which includes $30.5 billion for public transit and billions more for state governments that could be used for climate initiatives.18
Robinson Meyer, “The Weekly Planet: Biden’s Stimulus Is a Big Deal for Public Transit,” The Atlantic, March 10, 2021, https://www.theatlantic.com/science/archive/2021/03/bidens-stimulus-is-also-sort-of-a-climate-bill/618247/ (accessed April 28, 2022).
Congress further passed legislation requiring the reduction of hydrofluorocarbons (GHGs widely used as commercial coolants) and approved a program requiring states to reduce GHG emissions from highway transportation.19
U.S. Environmental Protection Agency, “Protecting Our Climate by Reducing Use of HFCs,” https://www.epa.gov/climate-hfcs-reduction (accessed April 28, 2022), and Katie Tubb, “Energy and Climate Policies, Cronyism Don’t Belong in Bloated Senate Infrastructure Bill,” The Daily Signal, August 3, 2021, https://www.dailysignal.com/2021/08/03/energy-and-climate-policies-cronyism-dont-belong-in-bloated-senate-infrastructure-bill.
Additional action could be on the horizon. The Environmental Protection Agency (EPA) could unilaterally pursue more stringent climate regulations on existing power plants, which the Supreme Court is reviewing in the case of West Virginia v. EPA.20
Katie Tubb, GianCarlo Canaparo, and Stephanie Luiz, “Supreme Court Takes Up Challenges to Near Limitless Power of EPA,” The Daily Signal, November 18, 2021, https://www.dailysignal.com/2021/11/18/supreme-court-takes-up-challenges-to-near-limitless-power-of-epa/.
The Administration could consider a border adjustment tariff that would levy new taxes on carbon-dioxide-intensive imports. Legislatively, Congress is considering several hundred billion dollars in tax credits and subsidies for investment, production, and consumption of wind power, solar energy, electric vehicles, and other alternative-energy products. Many Democrats have also endorsed a federal clean-electricity standard that would mandate that 100 percent of America’s power come from emissions-free sources by 2035.
Modeling the Economic and Climate Impact of Biden’s GHG Commitments
It is a challenging task to credibly estimate the cost of climate regulations, subsidies, and mandates on taxpayers, households, and the economy to achieve the Biden Administration’s Paris Agreement objectives. Increasing the cost of energy and narrowing the set of politically acceptable sources of energy increases costs throughout the economy, as energy is needed to produce nearly every good and service. However, without specific details on legislation or how proposed climate regulations would be implemented, we must make some assumptions about the details of changes in policy before producing an estimate of their effects on the economy.
To produce our estimate, we used the Heritage Energy Model (HEM), a clone of the U.S. Energy Information Administration’s (EIA’s) National Energy Modeling System (NEMS), to implement a carbon tax. Model simulations increased the value of a carbon tax until the emissions reductions met the Biden Administration’s targets of 50 percent to 52 percent below 2005 levels by 2030. As discussed in prior research, however, there are limitations to the ability of NEMS to handle high-level carbon taxes.21
Kevin D. Dayaratna and Nicolas D. Loris, “Assessing the Costs and Benefits of the Green New Deal’s Energy Policies,” Heritage Foundation Backgrounder No. 3427, July 24, 2019, https://www.heritage.org/energy-economics/report/assessing-the-costs-and-benefits-the-green-new-deals-energy-policies.
To assess the model’s capabilities in simulating the emissions reductions desired by the Biden Administration, we simulated the impact of a variety of carbon taxes and resulting carbon-dioxide (CO2) emissions reductions (with respect to 2005 levels) to ascertain what the model could handle. Again, it is worth noting that compared to the unchanged carbon tax we model in this Backgrounder, the many targeted policies, subsidies, and mandates mentioned above increase the cost and inefficiency of meeting the Biden Administration’s commitment under the Paris Agreement.
As presented in Chart 1, we began with a tax of $35 per ton of CO2 emissions and gradually increased the tax, which resulted in emissions reductions of 36 percent below 2005 levels. The highest tax that the model could handle was a tax of $300 per ton of CO2 emissions, which resulted in a 44 percent reduction in emissions with respect to 2005 levels by 2030.22
This carbon tax, and all carbon taxes above $35, were phased in over two years, and subsequently increased at a rate of 2.4 percent per year.
For perspective: The Biden Administration’s interim value for the social cost of carbon is $51 per ton. Carbon taxes above $300 result in the model crashing.
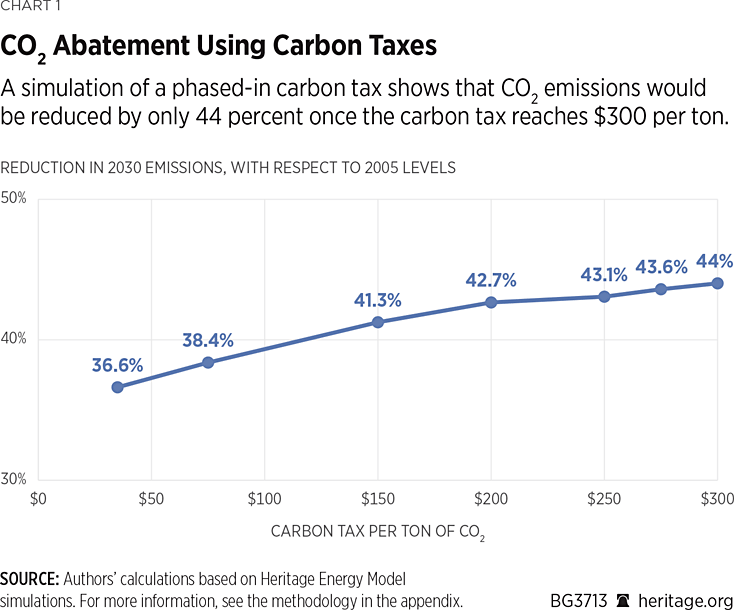
Thus, although the $300 tax appears to be the upper limit of carbon taxes that NEMS can currently handle, the economic impacts, contained in Charts 2, 3, and 4, likely underestimate the impact of the Biden Administration’s goals. Our model simulations find that between 2023 and 2040, the U.S. will incur:
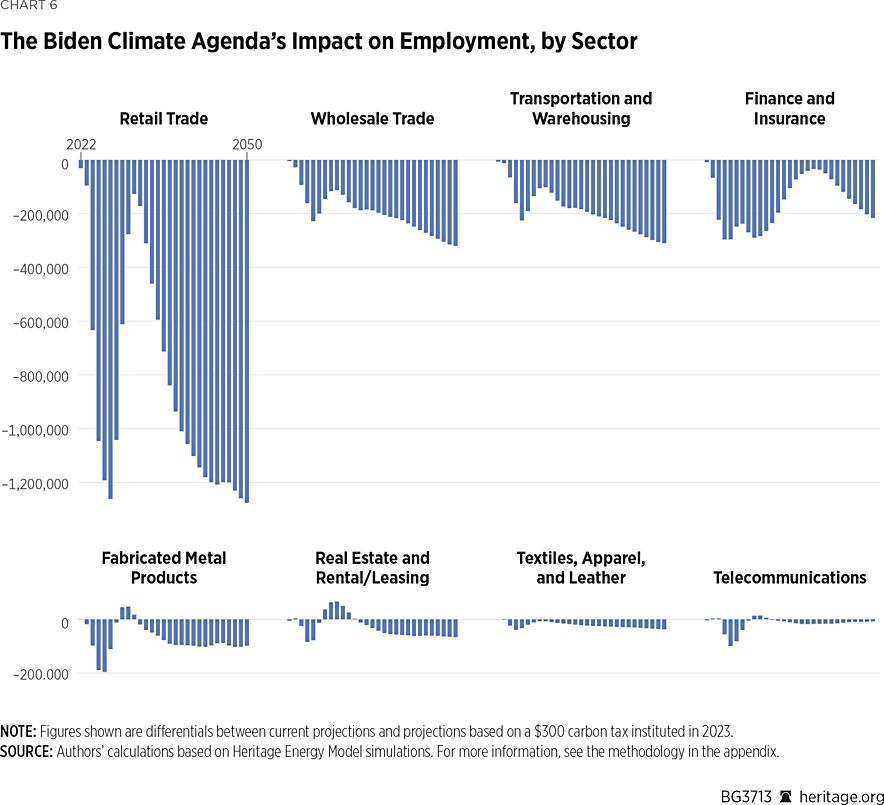
- An overall average reduction of more than 1.2 million jobs,
- A peak employment reduction of more than 7.8 million jobs,
- An average annual income loss for a family of four of $5,100,
- A total income loss for a family of four of more than $87,000 over the 18-year time horizon,
- An aggregate GDP loss of over $7.7 trillion over the 18-year time horizon,
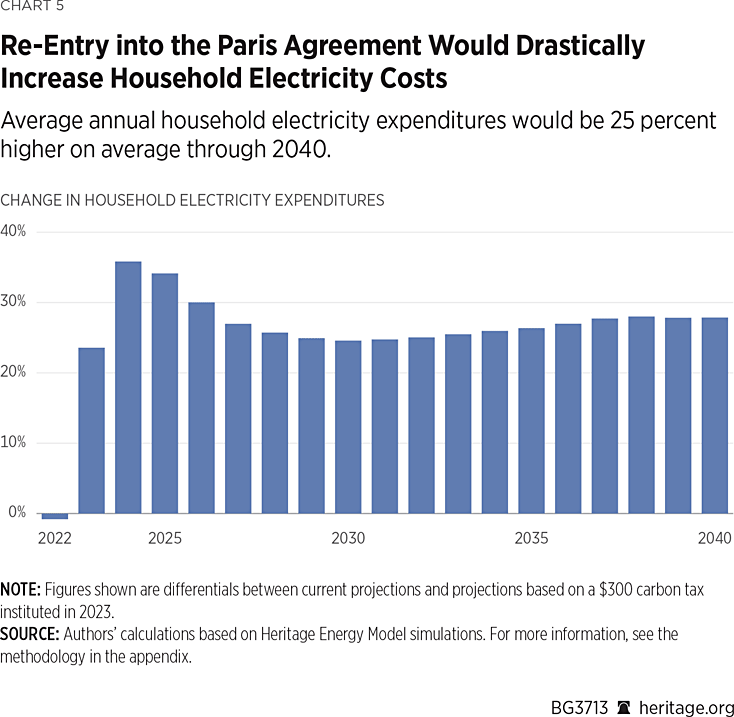
- An increase in household electricity expenditures averaging 23 percent per year, and
- An increase in gasoline prices of more than $2 per gallon annually beginning in 2024 (a more than 90 percent increase over current policy).
Charts 2, 3, and 4 present some sector-by-sector employment impacts as well. As is evident, the economic reverberations of re-entry into the Paris Agreement are manifested across the economy, ranging from financial services to telecommunications to various manufacturing industries, among others.
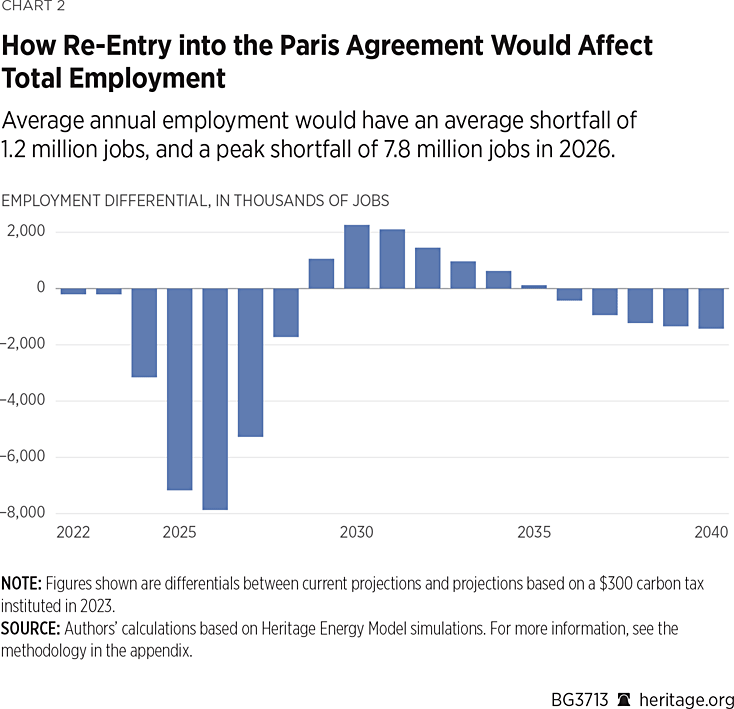
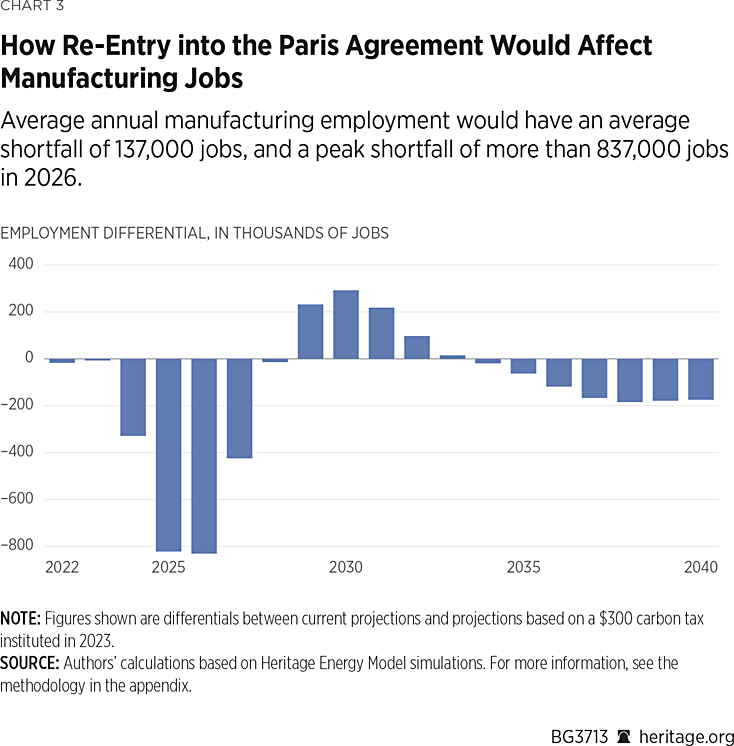
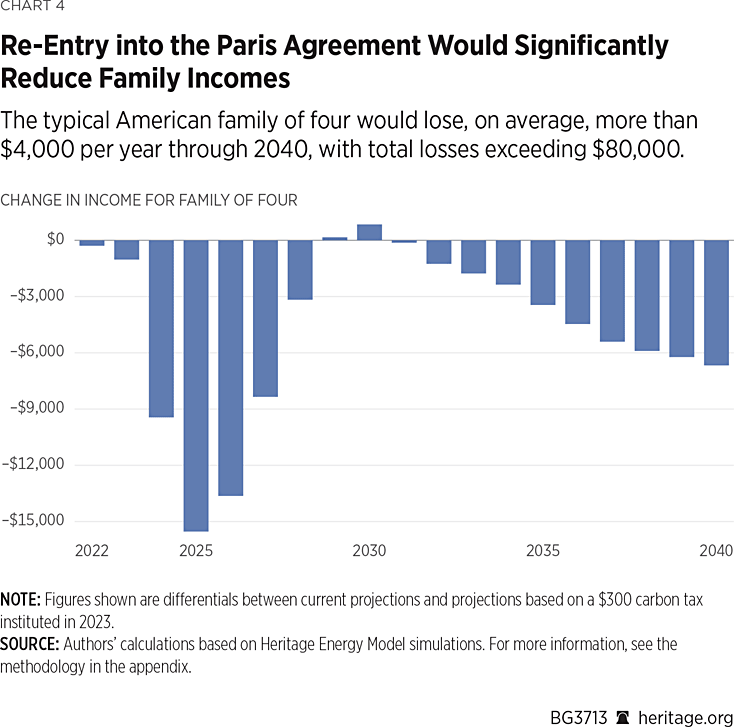
As our analysis demonstrates, the economic impact of re-entry into the Paris Agreement is quite significant. The reason is simple: Energy is a fundamental component of virtually all aspects of society and is essential to countless economic interactions. Conventional, carbon-intensive fuels—coal, oil, and natural gas—meet 79 percent of Americans’ total energy needs.23
U.S. Energy Information Administration, “U.S. Energy Facts Explained—Consumption & Production,” last updated May 14, 2021, https://www.eia.gov/energyexplained/us-energy-facts/ (accessed May 16, 2022), and U.S. Energy Information Administration, Monthly Energy Review, January 2022, Table 1.3, https://www.eia.gov/totalenergy/data/monthly/pdf/sec1_7.pdf (accessed April 27, 2022). The remaining energy came from nuclear power (8 percent) and renewables, including biomass, wind power, hydropower, and solar power (12 percent).
Petroleum meets 90 percent of Americans’ transportation fuel needs—energy used by automobiles, trucks, buses, trains, aircraft, and ships.24
U.S. Energy Information Administration, “U.S. Energy Consumption by Source and Sector, 2020,” https://www.eia.gov/totalenergy/data/monthly/pdf/flow/total_energy_2020.pdf (accessed April 27, 2022).
Thousands of products are made with oil, coal, and natural gas as feedstocks. Thus, policies that increase energy costs increase costs throughout the economy.
Furthermore, as discussed, the modeled impacts almost surely underestimate the true cost of the Biden Administration’s policy approach to climate change as the modeled policy ($300 carbon tax) would only reduce emissions to 44 percent of 2005 levels in 2030 and to 47 percent in 2040. While in theory a carbon tax would be relatively straightforward in its implementation, the slew of regulations, mandates, and subsidies would impose additional compliance costs, market distortions, litigation, and other economic costs.25
Richard S. J. Tol, “The Structure of the Climate Debate,” Energy Policy, Vol. 104 (May 2017), pp. 431–438, https://www.sciencedirect.com/science/article/pii/S0301421517300058 (accessed April 28, 2022), and William D. Nordhaus, “To Tax or Not to Tax: Alternative Approaches to Slowing Global Warming,” Review of Environmental Economics and Policy, Vol. 1, No. 1 (Winter 2007), pp. 26–44, https://www.journals.uchicago.edu/doi/10.1093/reep/rem008 (accessed April 28, 2022).
The collective costs of burdensome regulations, cronyist subsidies, and mandates that restrict consumer choice would be fewer jobs, lost household income, and a weaker economy—all without a meaningful climate benefit.
Can the Paris Agreement Mitigate Global Warming?
The Paris Agreement is an ill-suited mechanism to curb warming, even when accepting the dubious premise of catastrophic warming. With no enforcement mechanisms and no repercussions for failing to meet emissions reduction targets, countries can continue to emit GHGs well into the future. According to a November 2019 report from the Universal Ecological Fund, “Of the 184 climate pledges, 36 were deemed sufficient (20 percent), 12 partially sufficient (6 percent), 8 partially insufficient (4 percent) and 128 insufficient (70 percent)” for reaching the emissions reduction targets set out by the agreement.26
Robert Watson et al., “The Truth Behind the Climate Pledges,” Universal Ecological Fund, November 2019, https://www.researchgate.net/publication/337033405_The_Truth_Behind_the_Climate_Pledges (accessed April 28, 2022).
China, for example, is the world’s largest GHG emitter and is allowed to continue to increase emissions through 2030. China’s emissions are more than double those of the United States and more than those of the entire developed world combined.27
Hannah Ritchie and Max Roser, “CO2 Emissions,” Our World in Data, 2020, https://ourworldindata.org/co2-emissions (accessed April 28, 2022).
China’s total energy consumption has more than tripled since 2000 and it is the world’s top consumer and producer of coal, second for oil consumption, and third for natural gas consumption.28
Katie Tubb, “It’s Time for Climate Realism When It Comes to China,” The Daily Signal, May 27, 2021, https://www.dailysignal.com/2021/05/27/its-time-for-climate-realism-when-it-comes-to-china/.
With per capita energy consumption far below the OECD average, China likely will continue to grow as it looks both to its domestic energy needs and to international energy markets. Consequently, as noted several times by the President’s special climate envoy John Kerry, developed nations could eliminate all GHGs and there would still be no meaningful climate impact.29
Ebony Bowden, “Kerry Admits Zero Emissions in US Wouldn’t Make Difference in Climate Change,” New York Post, January 27, 2021, https://nypost.com/2021/01/27/kerry-zero-emissions-wont-make-difference-in-climate-change/ (accessed April 28, 2022).
Chart 7 contains a simulation using the Model for the Assessment of Greenhouse Gas Induced Climate Change (MAGICC), developed by researchers at the National Center for Atmospheric Research, that shows the impact of immediately eliminating all U.S. CO2 emissions generated by fossil fuels on global temperatures by the end of the century. In our simulations, we completely eliminated all CO2 emissions from fossil fuels as our alternative scenario and compared temperature forecasts through 2100 to current estimated forecasts in accordance with CO2-emissions trajectories suggested by the Intergovernmental Panel on Climate Change. (For full details, see the appendix.)
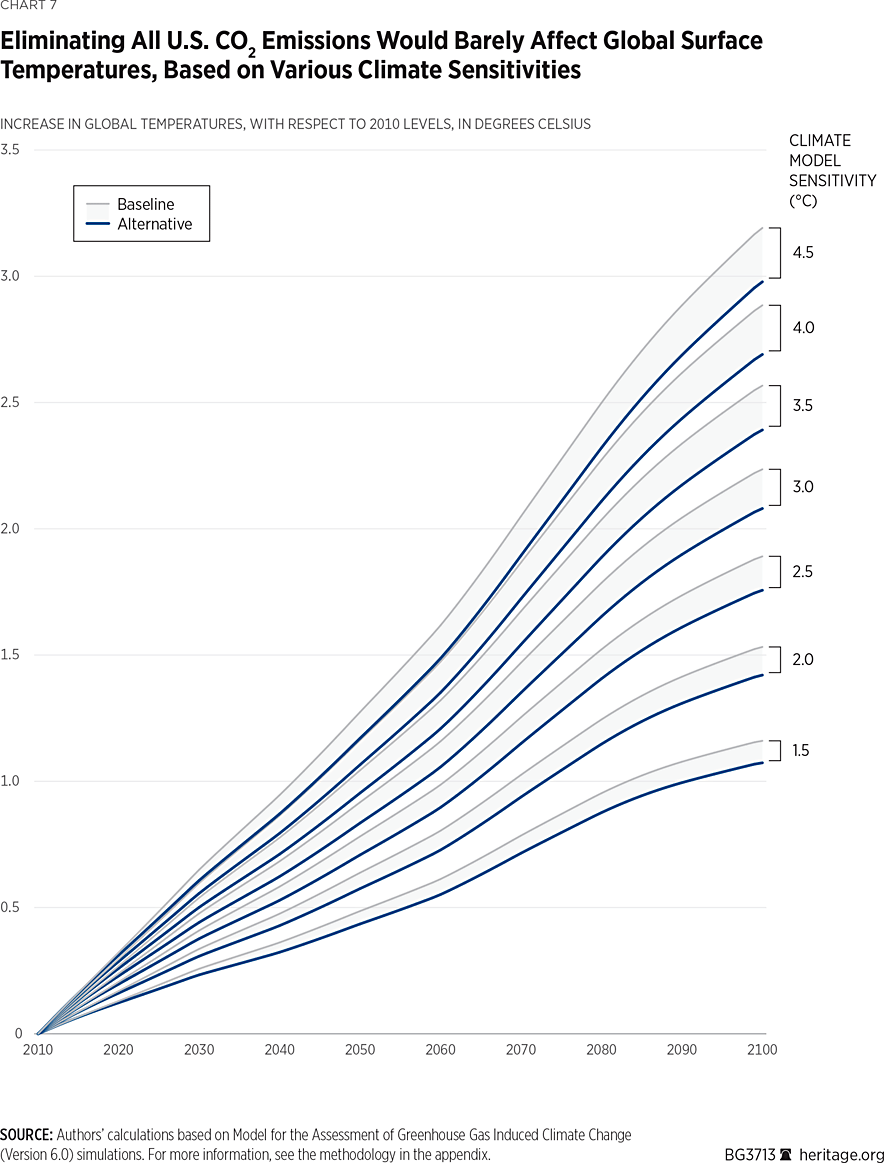
Even assuming that the Earth’s temperatures are highly sensitive to GHG emissions, eliminating all U.S. emissions would mitigate global temperatures by less than 0.2 degrees Celsius by 2100. Even if all other OECD economies eliminated GHG emissions as well, the world average temperature increase would be mitigated by no more than 0.5 degrees Celsius in 2100.30
The IPCC’s Fifth Assessment Report indicated a recommended range of climate sensitivity between 1.5 degrees and 4.5 degrees Celsius, corresponding with the assumptions made in the simulations presented in Chart 5, with no “best estimate” provided. In the more recent Sixth Assessment Report, the recommended range is 2 to 5 degrees Celsius with the authors stating “high confidence” in the lower bound, “medium confidence” in the upper bound, and “high confidence” in an upper bound of 4 degrees Celsius. Under separate simulations, we found that even under a 5 degrees Celsius climate sensitivity, if CO2 emissions from fossil fuels were to be eliminated completely, the impact would still be less than 0.24 degrees Celsius reduction in global temperatures by 2100 and less than 0.55 degrees Celsius if emissions were eliminated from all OECD countries. See Climate Change 2014: Synthesis Report (Geneva: Intergovernmental Panel on Climate Change, 2015), https://www.ipcc.ch/site/assets/uploads/2018/02/SYR_AR5_FINAL_full.pdf (accessed May 16, 2022), and Intergovernmental Panel on Climate Change, “IPCC Sixth Assessment Report: Working Group 1: The Physical Science Basis,” Summary for Policymakers, https://www.ipcc.ch/report/ar6/wg1/downloads/report/IPCC_AR6_WGI_SPM.pdf (accessed May 28, 2022).
If there were legally binding targets and enforcement mechanisms, however, it is very likely that countries would not have signed on and ratified the agreement. Energy is essential to peoples’ health, well-being, and economic opportunity and has been a key driver in the dramatic decrease in mortality and extreme poverty over the past century. Consequently, people are reluctant to curb access to energy.31
See, for example, Nupur Anand and Sudarshan Varadhan, “‘Bad Boys’ Are Back: India Doubles Down on Coal as Heatwave Worsens Power Crisis,” Reuters, May 6, 2022, https://www.reuters.com/world/india/india-looking-boost-coal-output-by-up-100-mln-tonnes-reopen-closed-mines-2022-05-06/ (accessed June 8, 2022), and Anmar Frangoul, “Volkswagen Is Prolonging Its Use of Coal Due to Russian Energy ‘Threat,’” CNBC, May 4, 2022, https://www.cnbc.com/2022/05/04/volkswagen-to-prolong-coal-fired-power-as-russia-concerns-continue.html (accessed June 8, 2022).
Perhaps more indicative of the Paris Agreement’s inability to impact global temperatures, then, is its failure to address the growing need for energy around the world.
In 2020, 83 percent of global energy consumption for power, transportation, and heat was met by CO2-emitting energy resources (coal, oil, and natural gas), with the remainder met through a combination of hydropower, renewable energy technologies (including biomass), and nuclear power.32
BP, “Statistical Review of World Energy,” 70th edition, July 2021, https://www.bp.com/content/dam/bp/business-sites/en/global/corporate/pdfs/energy-economics/statistical-review/bp-stats-review-2021-full-report.pdf (accessed April 28, 2022).
This percentage has remained roughly unchanged for decades, even as global consumption of energy has increased and renewable energy technologies have entered energy markets.33
Hannah Ritchie and Max Roser, “Energy Production and Consumption,” Our World in Data, 2020, https://ourworldindata.org/energy-production-consumption (accessed April 28, 2022).
The EIA’s International Energy Outlook projects global energy use to increase by 50 percent by 2050, and projects no scenario in which global demand for oil and natural gas do not increase through at least 2050.34
U.S. Energy Information Administration, “International Energy Outlook 2021,” October 2021, https://www.eia.gov/outlooks/ieo/pdf/IEO2021_Narrative.pdf (accessed April 28, 2022).
Coal use is expected to decline, but persist as an important source of energy globally.
No one knows what the future holds. (Very few expected the energy boom created by affordable, efficient hydraulic fracking technology.) However, the EIA’s projections provide a more realistic and useful framework for policymakers when thinking about the future.35
Katie Tubb, “Fueling the Climate Crisis: Examining Big Oil’s Climate Pledges,” testimony before the Committee on Oversight and Reform, U.S. House of Representatives, February 8, 2022, https://oversight.house.gov/sites/democrats.oversight.house.gov/files/Tubb%20Testimony.pdf (accessed April 28, 2022).
Better Than Paris
As shown, U.S. adherence to the targets of the Paris Agreement provides no more than trivial benefits, if any, and does so at an extraordinarily high cost to average Americans. It is neither reasonable nor laudable to push policies that have real costs to American families and businesses and further erode the American system of limited, representative government for no environmental benefit.
A better approach is the dynamic path that encourages economic freedom and growth. This is the proven path that has made people more prosperous and resilient, characteristics that are necessary for whatever challenges the future holds. History bears out that there is good reason to believe in the creativity of people to solve problems, innovate, adapt, and improve the world around them—and conversely, little reason to trust in the ability of the federal government, much less the combined signatories of the Paris Agreement, to manage an entire overhaul of the energy sector and economy with it. Data from the Index of Economic Freedom over decades clearly show that economic freedom goes hand in hand with economic growth, which is essential to environmental stewardship.36
Terry Miller, Anthony B. Kim, and James M. Roberts, eds., 2022 Index of Economic Freedom (Washington, DC: The Heritage Foundation, 2022), https://www.heritage.org/index/.
Contrary to the assertions of ideologically driven activists, economic freedom has provided real environmental benefits, such as more food from less land, reduced emissions of all sorts, and increasingly efficient technologies. In the past century, extreme poverty—the normal condition for most people and for most of human history—plummeted 80 percent, thanks to economic growth and access to energy.37
Joe Hasell and Max Roser, “How Do We Know the History of Extreme Poverty?” Our World in Data, February 5, 2019, https://ourworldindata.org/extreme-history-methods (accessed April 28, 2022).
Global crop yields of grains increased over 200 percent.38
Hannah Ritchie and Max Roser, “Crop Yields,” Our World in Data, June 2021, https://ourworldindata.org/crop-yields (accessed April 28, 2022).
Deaths from climate-related disasters decreased 96 percent.39
Hannah Ritchie and Max Roser, “Natural Disasters,” Our World in Data, November 2021, https://ourworldindata.org/natural-disasters#what-share-of-deaths-are-from-natural-disasters (accessed April 28, 2022).
As a percentage of global GDP, damages from natural disasters have declined since 1990.40
Roger Pielke, Jr., “21st Century Communities: Climate Change, Resilience, and Reinsurance,” testimony before the Committee on Banking, Housing, and Urban Affairs, U.S. Senate, July 20, 2021, https://www.banking.senate.gov/imo/media/doc/Pielke%20Testimony%207-20-21.pdf (accessed April 28, 2022).
Air pollution in the U.S. (not to be confused with GHG emissions) has declined 73 percent since 1980.41
U.S. Environmental Protection Agency, “Air Quality–National Summary,” https://www.epa.gov/air-trends/air-quality-national-summary (accessed April 28, 2022).
Even assuming the worst to come of global warming, the IPCC estimates that per capita GDP will be $69,000 higher if the world follows a fossil-fuel-development path rather than a “sustainable-development” path even after subtracting damages from global warming.42
David Kreutzer, “Book Review: False Alarm by Bjørn Lomborg,” Institute for Energy Research, July 7, 2020, https://www.instituteforenergyresearch.org/climate-change/book-review-false-alarm-by-bjorn-lomborg/ (accessed April 28, 2022).
In other words, “net-zero” policies are far more damaging than global warming itself.
The choice between a healthy environment and economic growth is a false one. Instead of an agenda that will decrease Americans’ access to energy and cost trillions, President Biden and Congress should pursue a policy agenda that advances economic freedom and rejects symbolic but ineffective climate policies and reduces barriers to innovation and economic opportunity. An environmentally resilient future is one in which Americans are not crushed under the burden of federal debt and regulation, energy is affordable and abundant, and innovators have freedom from cronyism to develop their ideas and export those to the world.
Kevin D. Dayaratna, PhD, is Chief Statistician, Data Scientist, and Senior Research Fellow in the Center for Data Analysis at The Heritage Foundation. Katie Tubb is Research Fellow for Energy and the Environment in the Center for Energy, Climate, and Environment at The Heritage Foundation. David Kreutzer is Senior Economist at the Institute for Energy Research.
Appendix: Methodology
The Heritage Energy Model
The analysis in this Backgrounder uses the Heritage Energy Model (HEM), a clone of the National Energy Model System 2021 Full Release (NEMS).43
U.S. Department of Energy, Energy Information Administration, “Documentation of the National Energy Modeling System Modules,” https://www.eia.gov/outlooks/aeo/nems/documentation/ (accessed April 28, 2022). We specifically altered the agency’s codes for its carbon-fee cases published in November 2021. U.S. Energy Information Administration, “Annual Energy Outlook 2021,” November 17, 2021, https://www.eia.gov/outlooks/aeo/emissions/carbon_fee/ (accessed February 4, 2022).
NEMS is used by the Energy Information Administration (EIA) in the Department of Energy as well as various nongovernmental organizations for a variety of purposes, including forecasting the effects of energy policy changes on a plethora of leading economic indicators.
The methodologies, assumptions, conclusions, and opinions in this Backgrounder are entirely the work of statisticians and economists in the Center for Data Analysis (CDA) at The Heritage Foundation and have not been endorsed by, and do not necessarily reflect the views of, the developers of NEMS.
HEM is based on well-established economic theory as well as historical data and contains a variety of modules that interact with each other for long-term forecasting. In particular, HEM focuses on the interactions among
- The supply, conversion, and demand of energy in its various forms;
- American energy and the overall American economy;
- The American energy market and the world petroleum market; and
- Current production and consumption decisions as well as expectations about the future.44
Ibid., pp. 3 and 4.
These modules are the:
- Macroeconomic Activity Module,45
HEM’s Macroeconomic Activity Module uses the IHS Global Insight Model, which is used by government agencies and Fortune 500 organizations to forecast the effects of economic events and policy changes on notable economic indicators. As with NEMS, the methodologies, assumptions, conclusions, and opinions in this Backgrounder are entirely the work of CDA statisticians and economists, and have not been endorsed by, and do not necessarily reflect the view of, the owners of the IHS Global Insight model.
- Transportation Demand Module,
- Residential Demand Module,
- Industrial Demand Module,
- Commercial Demand Module,
- Coal Market Module,
- Electricity Market Module,
- Liquid Fuels Market Module,
- Oil and Gas Supply Module,
- Renewable Fuels Module,
- Natural Gas Market Module, and
- International Energy Activity Module.
HEM is identical to the EIA’s NEMS with the exception of the Commercial Demand Module. The Commercial Demand Module makes projections pertaining to commercial floor-space data of pertinent commercial buildings. Other than HEM not having this module, it is identical to NEMS.
Overarching these modules is an Integrating Module, which consistently cycles, iteratively executing and allowing these various modules to interact with each other. Unknown variables that are related, such as a component of a particular module, are grouped together, and a pertinent subsystem of equations and inequalities corresponding to each group is solved via a variety of commonly used numerical analytic techniques, using approximate values for the other unknowns. Once a group’s values are computed, the next group is solved similarly, and the process iterates. After all group values for the current cycle are determined, the next cycle begins. At each particular cycle, a variety of pertinent statistics is obtained.46
Steven A. Gabriel, Andy S. Kydes, and Peter Whitman, “The National Energy Modeling System: A Large-Scale Energy-Economic Equilibrium Model,” Operations Research, Vol. 49, No. 1 (January–February 2001), pp. 14–25, http://pubsonline.informs.org/doi/pdf/10.1287/opre.49.1.14.11195 (accessed April 28, 2022).
HEM provides a number of diagnostic measures, based on differences between cycles, to indicate whether a stable solution has been achieved.
This report uses HEM to analyze the impact of a carbon tax as well as carbon-related regulations on the economy. As illustrated in Chart 1 of this Backgrounder, we modeled $35, $54, $75, $100, $150, and $300 carbon taxes (per ton of carbon). The carbon tax begins in 2023 with half of the specified value per ton of CO2, doubles to its full value the following year, and increases annually by 2.5 percent each year thereafter. In our simulations, we rebated the revenue collected from the tax back to consumers in a deficit-neutral manner.
The Model for the Assessment of Greenhouse Gas Induced Climate Change
The analysis in this Backgrounder also uses the Model for the Assessment of Greenhouse Gas Induced Climate Change (MAGICC) version 6.47
M. Meinshausen, S. C. B. Raper, and T. M. L. Wigley, “Emulating Coupled Atmosphere–Ocean and Carbon Cycle Models with a Simpler Model, MAGICC6– Part 1: Model Description and Calibration,” Atmospheric Chemistry and Physics, Vol. 11 (2011), pp. 1417–1456, https://acp.copernicus.org/articles/11/1417 /2011/ (accessed May 16, 2022).
The MAGICC model quantifies the relationship between atmospheric radiative forcing, oceanic heat content, and surface temperature perturbation via the following relationship:
ΔQG=λG◻ΔTG+dHdt,
where ΔQG is the global-mean radiative forcing at the top of the troposphere. This extra energy influx is decomposed into increased outgoing energy flux and heat content changes in the ocean via the derivative dHdt . The outgoing energy flux is related to the global-mean feedback factor λλG as well as surface temperature perturbation ΔTG.
Climate sensitivity, denoted in the MAGICC model as ΔT2x, is defined as the equilibrium global-mean warming after a doubling of carbon-dioxide concentrations and specified via a reciprocal relationship to a feedback factor λλ:
ΔT2x=ΔQ2xλ.
In the above equation, ΔT2x represents the climate sensitivity and ΔQ2x represents the radiative forcing following a doubling of carbon-dioxide concentrations. The time or state-dependent effective climate sensitivity St is defined by combining the above two equations as follows:
St=ΔQ2xλt=ΔQ2xΔTGtΔQt−dHdt|t,
where ΔQ2x represents the model-specific forcing for doubled carbon-dioxide concentration, λλt represents the time-specific feedback factor, ΔQt represents the radiative forcing, ΔTGt represents the global-mean temperature perturbation, and dHdt|t represents the climate system’s heat uptake at time t.
MAGICC also contains a carbon-cycle model that incorporates temperature feedback effects. One of the a priori specifications pertaining to this model is a greenhouse gas emissions trajectory. We assumed trajectories specified in the model based on the most recent Intergovernmental Panel on Climate Change Assessment Reports (IPCC). In our simulations, we used and modified Representative Concentration Pathway 6.0 (RCP6), provided as a potential baseline scenario with the model and specified in the IPCC’s Fifth Assessment Report.48
Intergovernmental Panel on Climate Change, Emissions Scenarios (Cambridge, U.K.: Cambridge University Press, 2000), https://www.ipcc.ch/site/assets/uploads/2018/03/emissions_scenarios-1.pdf (accessed May 16, 2022); Robert T. Watson et al., eds., Climate Change 2001: Synthesis Report (Cambridge, U.K.: Cambridge University Press, 2001), http://www.grida.no/publications/267 (accessed May 16, 2022); Lenny Bernstein et al., eds., Climate Change 2007: Synthesis Report (Geneva: Intergovernmental Panel on Climate Change, 2008), https://www.ipcc.ch/site/assets/uploads/2018/02/ar4_syr_full_report.pdf (accessed May 16, 2022); and Rajendra K. Pachauri et al., eds., Climate Change 2014: Synthesis Report (Geneva: Intergovernmental Panel on Climate Change, 2015), https://www.ipcc.ch/site/assets/uploads/2018/02/SYR_AR5_FINAL_full.pdf (accessed May 16, 2011).
Using data from the Environmental Protection Agency, we found that the United States emitted approximately 43 percent of carbon-dioxide emissions with respect to all Organization for Economic Co-operation and Development (OECD) member nations.49
Organization for Economic Co-operation and Development, “Greenhouse Gas Emissions,” for 1990 to 2019, https://stats.oecd.org/Index.aspx?DataSetCode=AIR_GHG (accessed June 7, 2022).
In our simulations, we altered OECD projections accordingly assuming this fraction to be constant over time. Subsequently, we modified RCP6 by completely eliminating carbon-dioxide emissions from fossil fuels in the United States, and separately, all OECD countries, beginning in 2020. Our results thus overstate the estimated temperature impact of the suggested GHG reduction policy.50
In our simulations, this increase does not occur until 2100, and thus our implementation of them in 2030 in the MAGICC model vastly overestimates the estimated temperature impact of the suggested policy.
In the simulations presented in Chart 5, we assumed climate sensitivities between 1.5 and 4.5 degrees Celsius, the stated acceptable range of the IPCC’s Fifth Assessment Report and encompassing the “high confidence range” in the IPCC’s Sixth Assessment Report.51
The IPCC’s Sixth Assessment Report provides a recommended range of climate sensitivity between 2.0 and 5.0 degrees Celsius, with the upper bound being referred to as a “medium confidence” bound. We also ran simulations under this upper bound, and results are discussed in footnote 30 of this Backgrounder. In estimating the social cost of carbon, the Obama Administration had used a mean climate sensitivity of approximately 3 degrees Celsius, and thus the upper bounds of climate sensitivity assumed in this Backgrounder are well above this assumption. The Biden Administration is currently updating the Obama Administration’s estimates but has yet to publish original results other than updating the Obama Administration’s estimates. See Interagency Working Group on Social Cost of Carbon, “Technical Support Document: Technical Update of the Social Cost of Carbon for Regulatory Impact Analysis Under Executive Order 12866,” May 2013, https://obamawhitehouse.archives.gov/sites/default/files/omb/assets/inforeg/technical-update-social-cost-of-carbon-for-regulator-impact-analysis.pdf (accessed June 8, 2022), and Kevin D. Dayaratna, “Why ‘Social Cost of Carbon’ Is the Most Useless Number You’ve Never Heard Of,” The Daily Signal, March 2, 2021, https://www.dailysignal.com/2021/03/02/why-social-cost-of-carbon-is-most-useless-number-youve-never-heard-of/.
Authors

Chief Statistician, Data Scientist, Senior Research Fellow

Research Fellow, Center for Energy, Climate, and Environment

Former Senior Research Fellow, Labor Markets and Trade


