
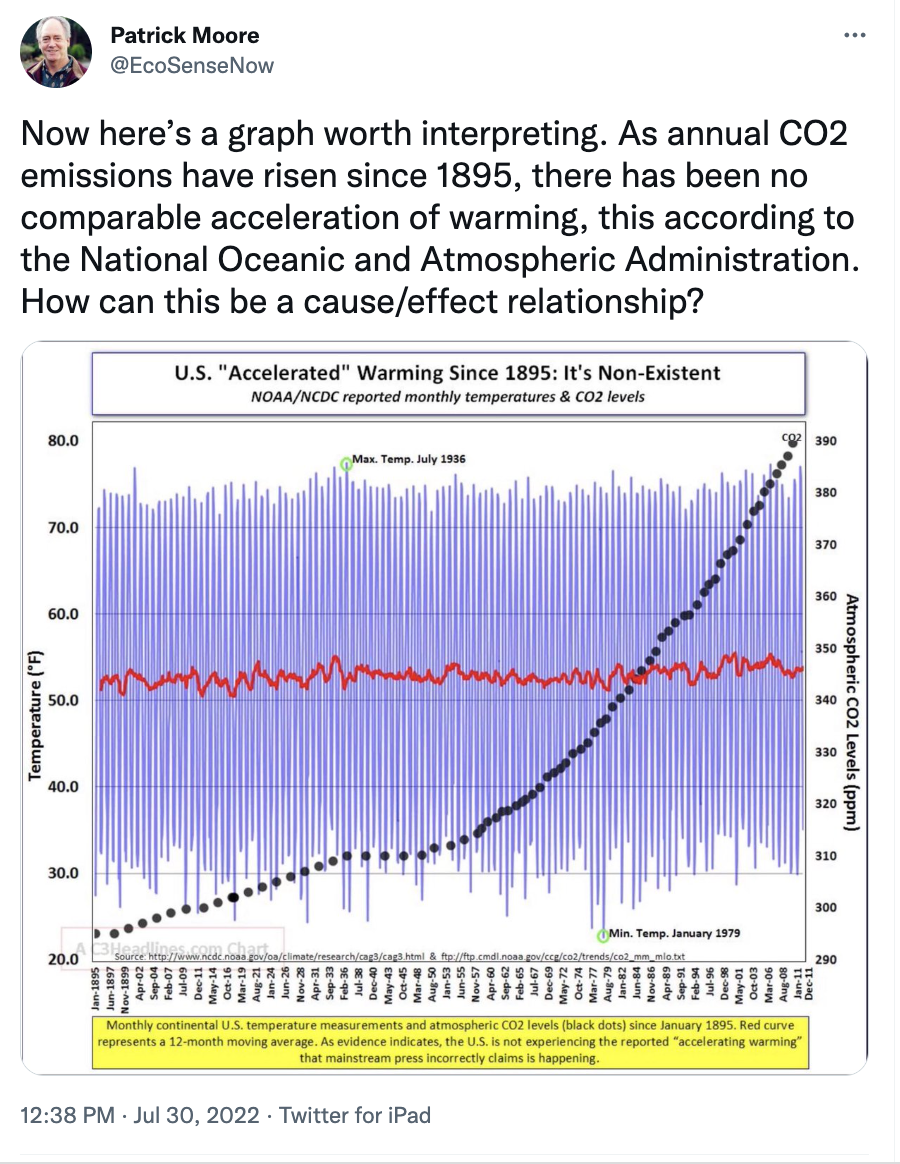
Now here’s a graph worth interpreting. As annual CO2 emissions have risen since 1895, there has been no comparable acceleration of warming, this according to the National Oceanic and Atmospheric Administration. How can this be a cause/effect relationship? pic.twitter.com/bgmSX3cdwF
— Patrick Moore (@EcoSenseNow) July 30, 2022
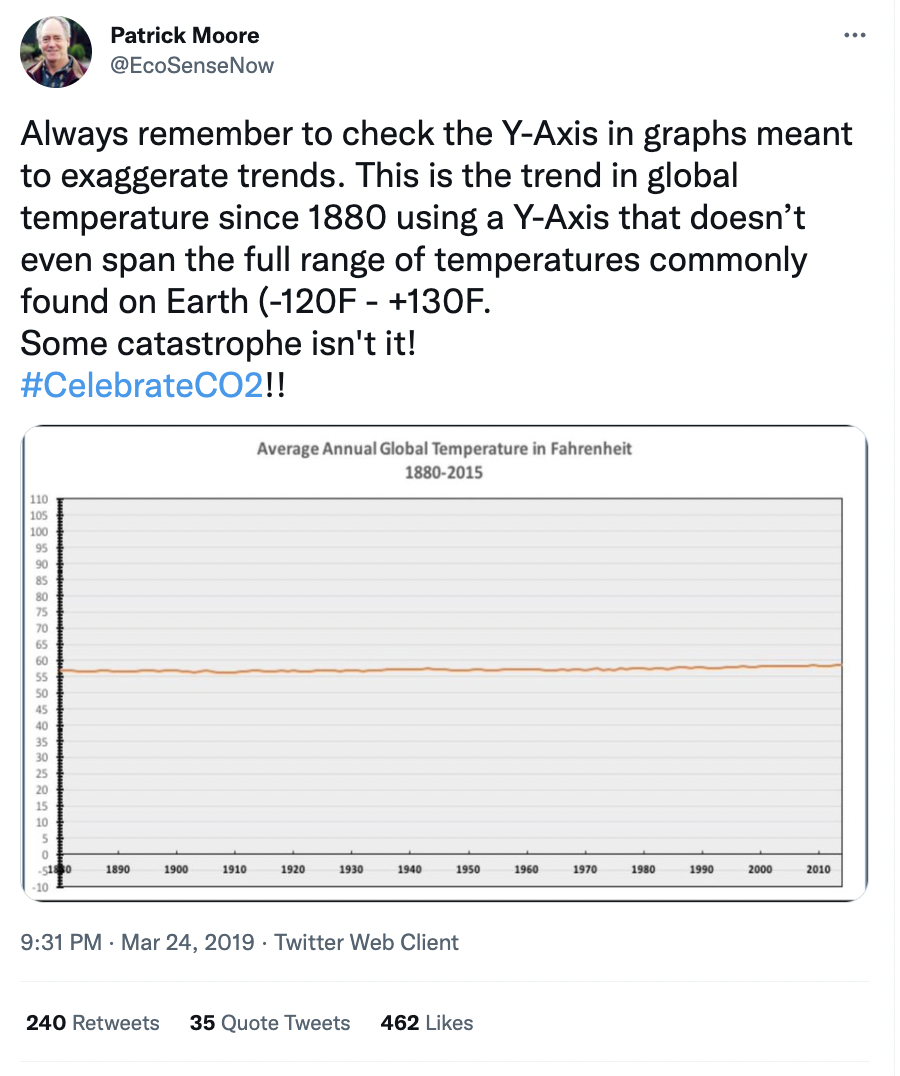
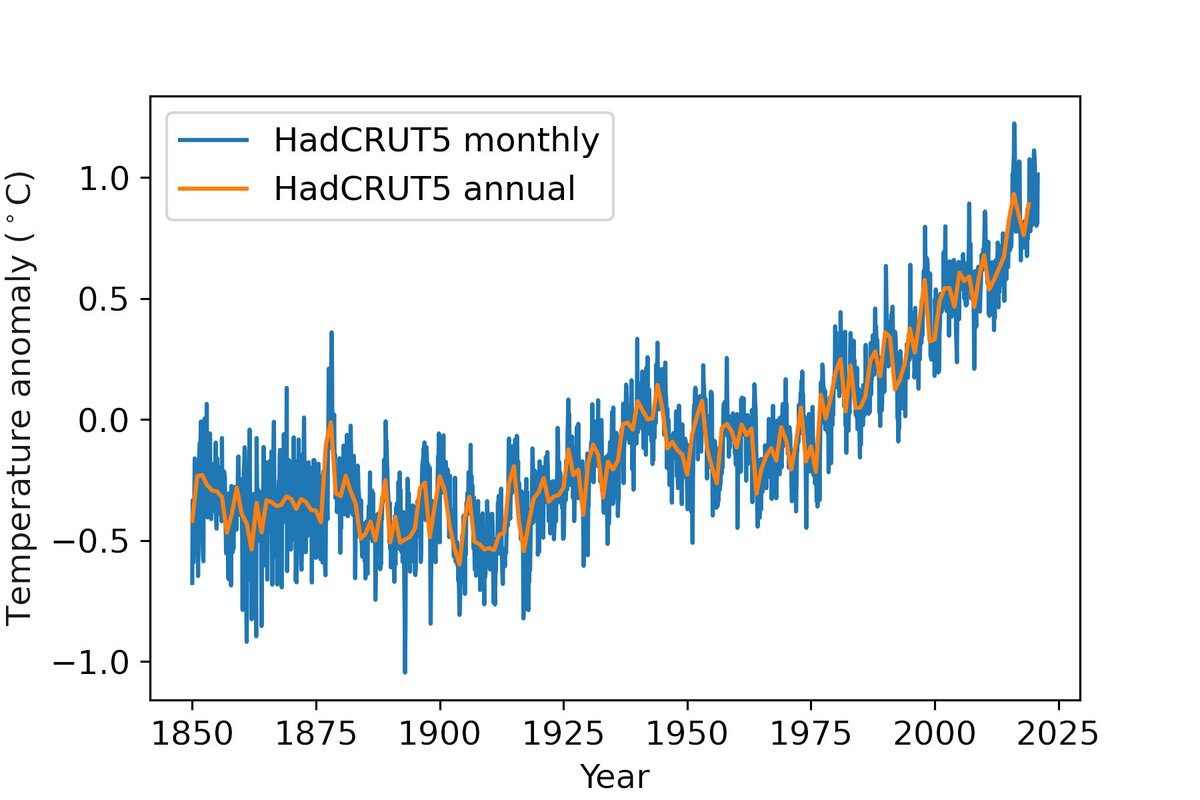
Always remember to check the Y-Axis in graphs meant to exaggerate trends. This is the trend in global temperature since 1880 using a Y-Axis that doesn’t even span the full range of temperatures commonly found on Earth (-120F – +130F.
Some catastrophe isn't it!#CelebrateCO2!! pic.twitter.com/oIXe1R5bW7— Patrick Moore (@EcoSenseNow) March 25, 2019
Dr. Patrick Moore: “Always remember to check the Y-Axis in graphs meant to exaggerate trends. This is the trend in global temperature since 1880 using a Y-Axis that doesn’t even span the full range of temperatures commonly found on Earth (-120F – +130F.
Some catastrophe isn’t it!
#CelebrateCO2!!”
#


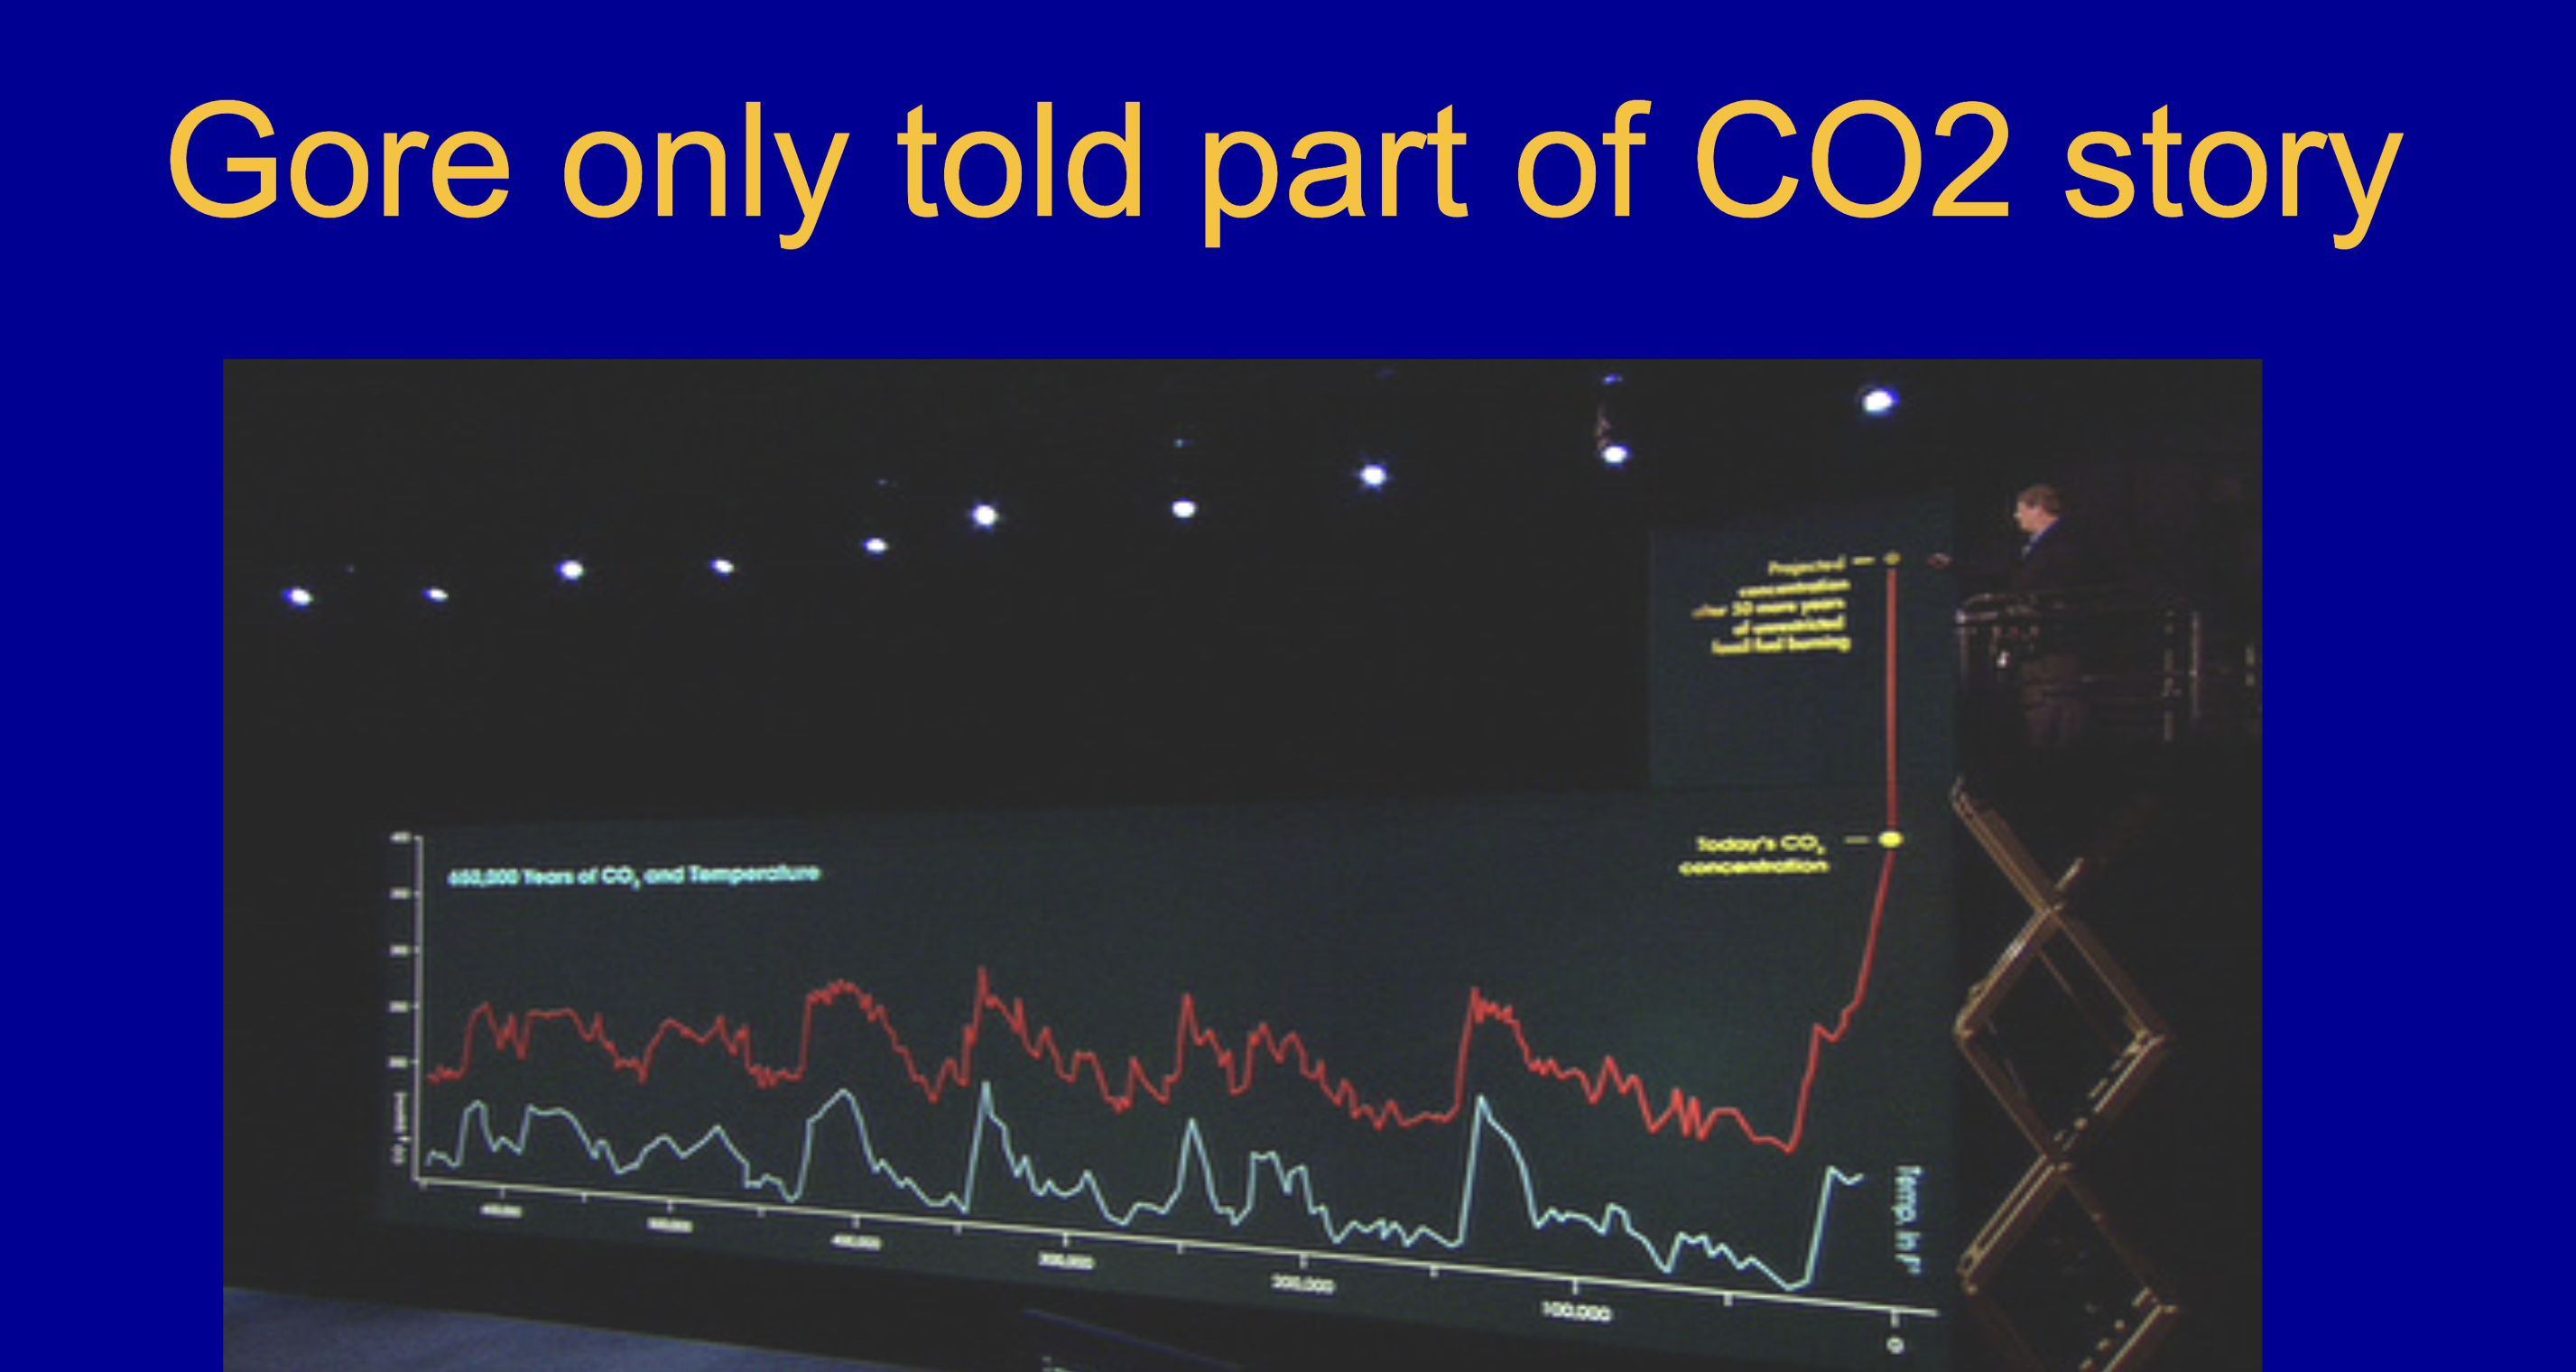
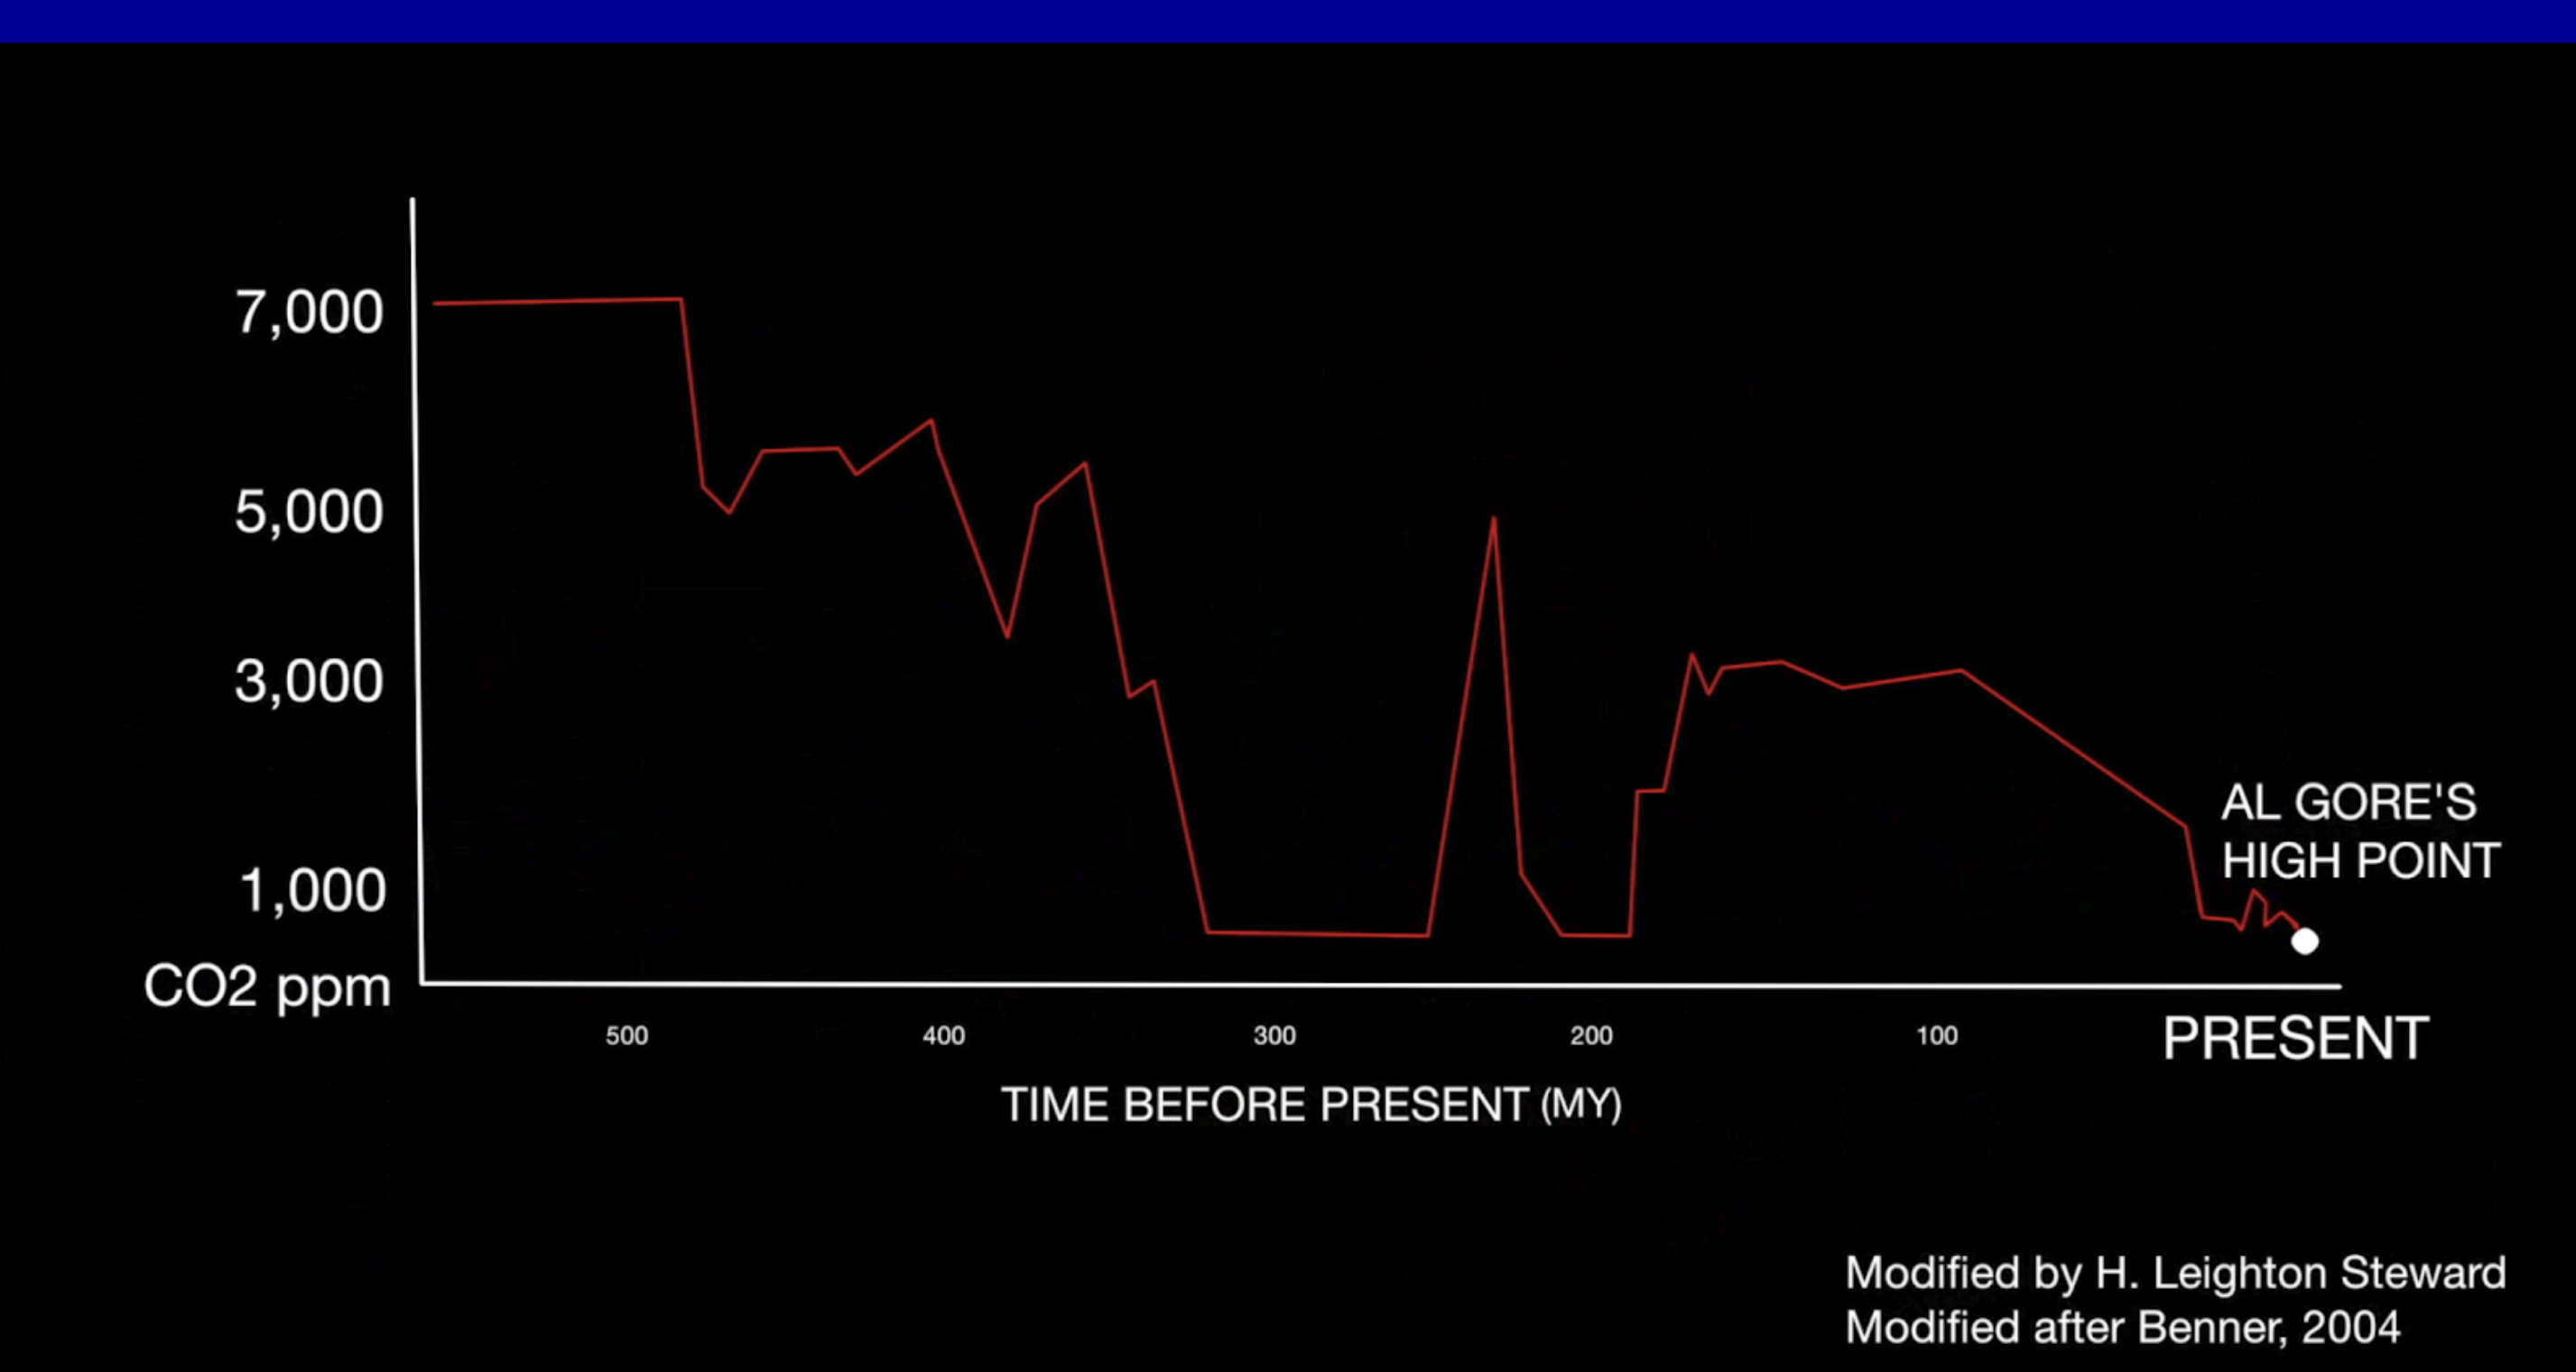
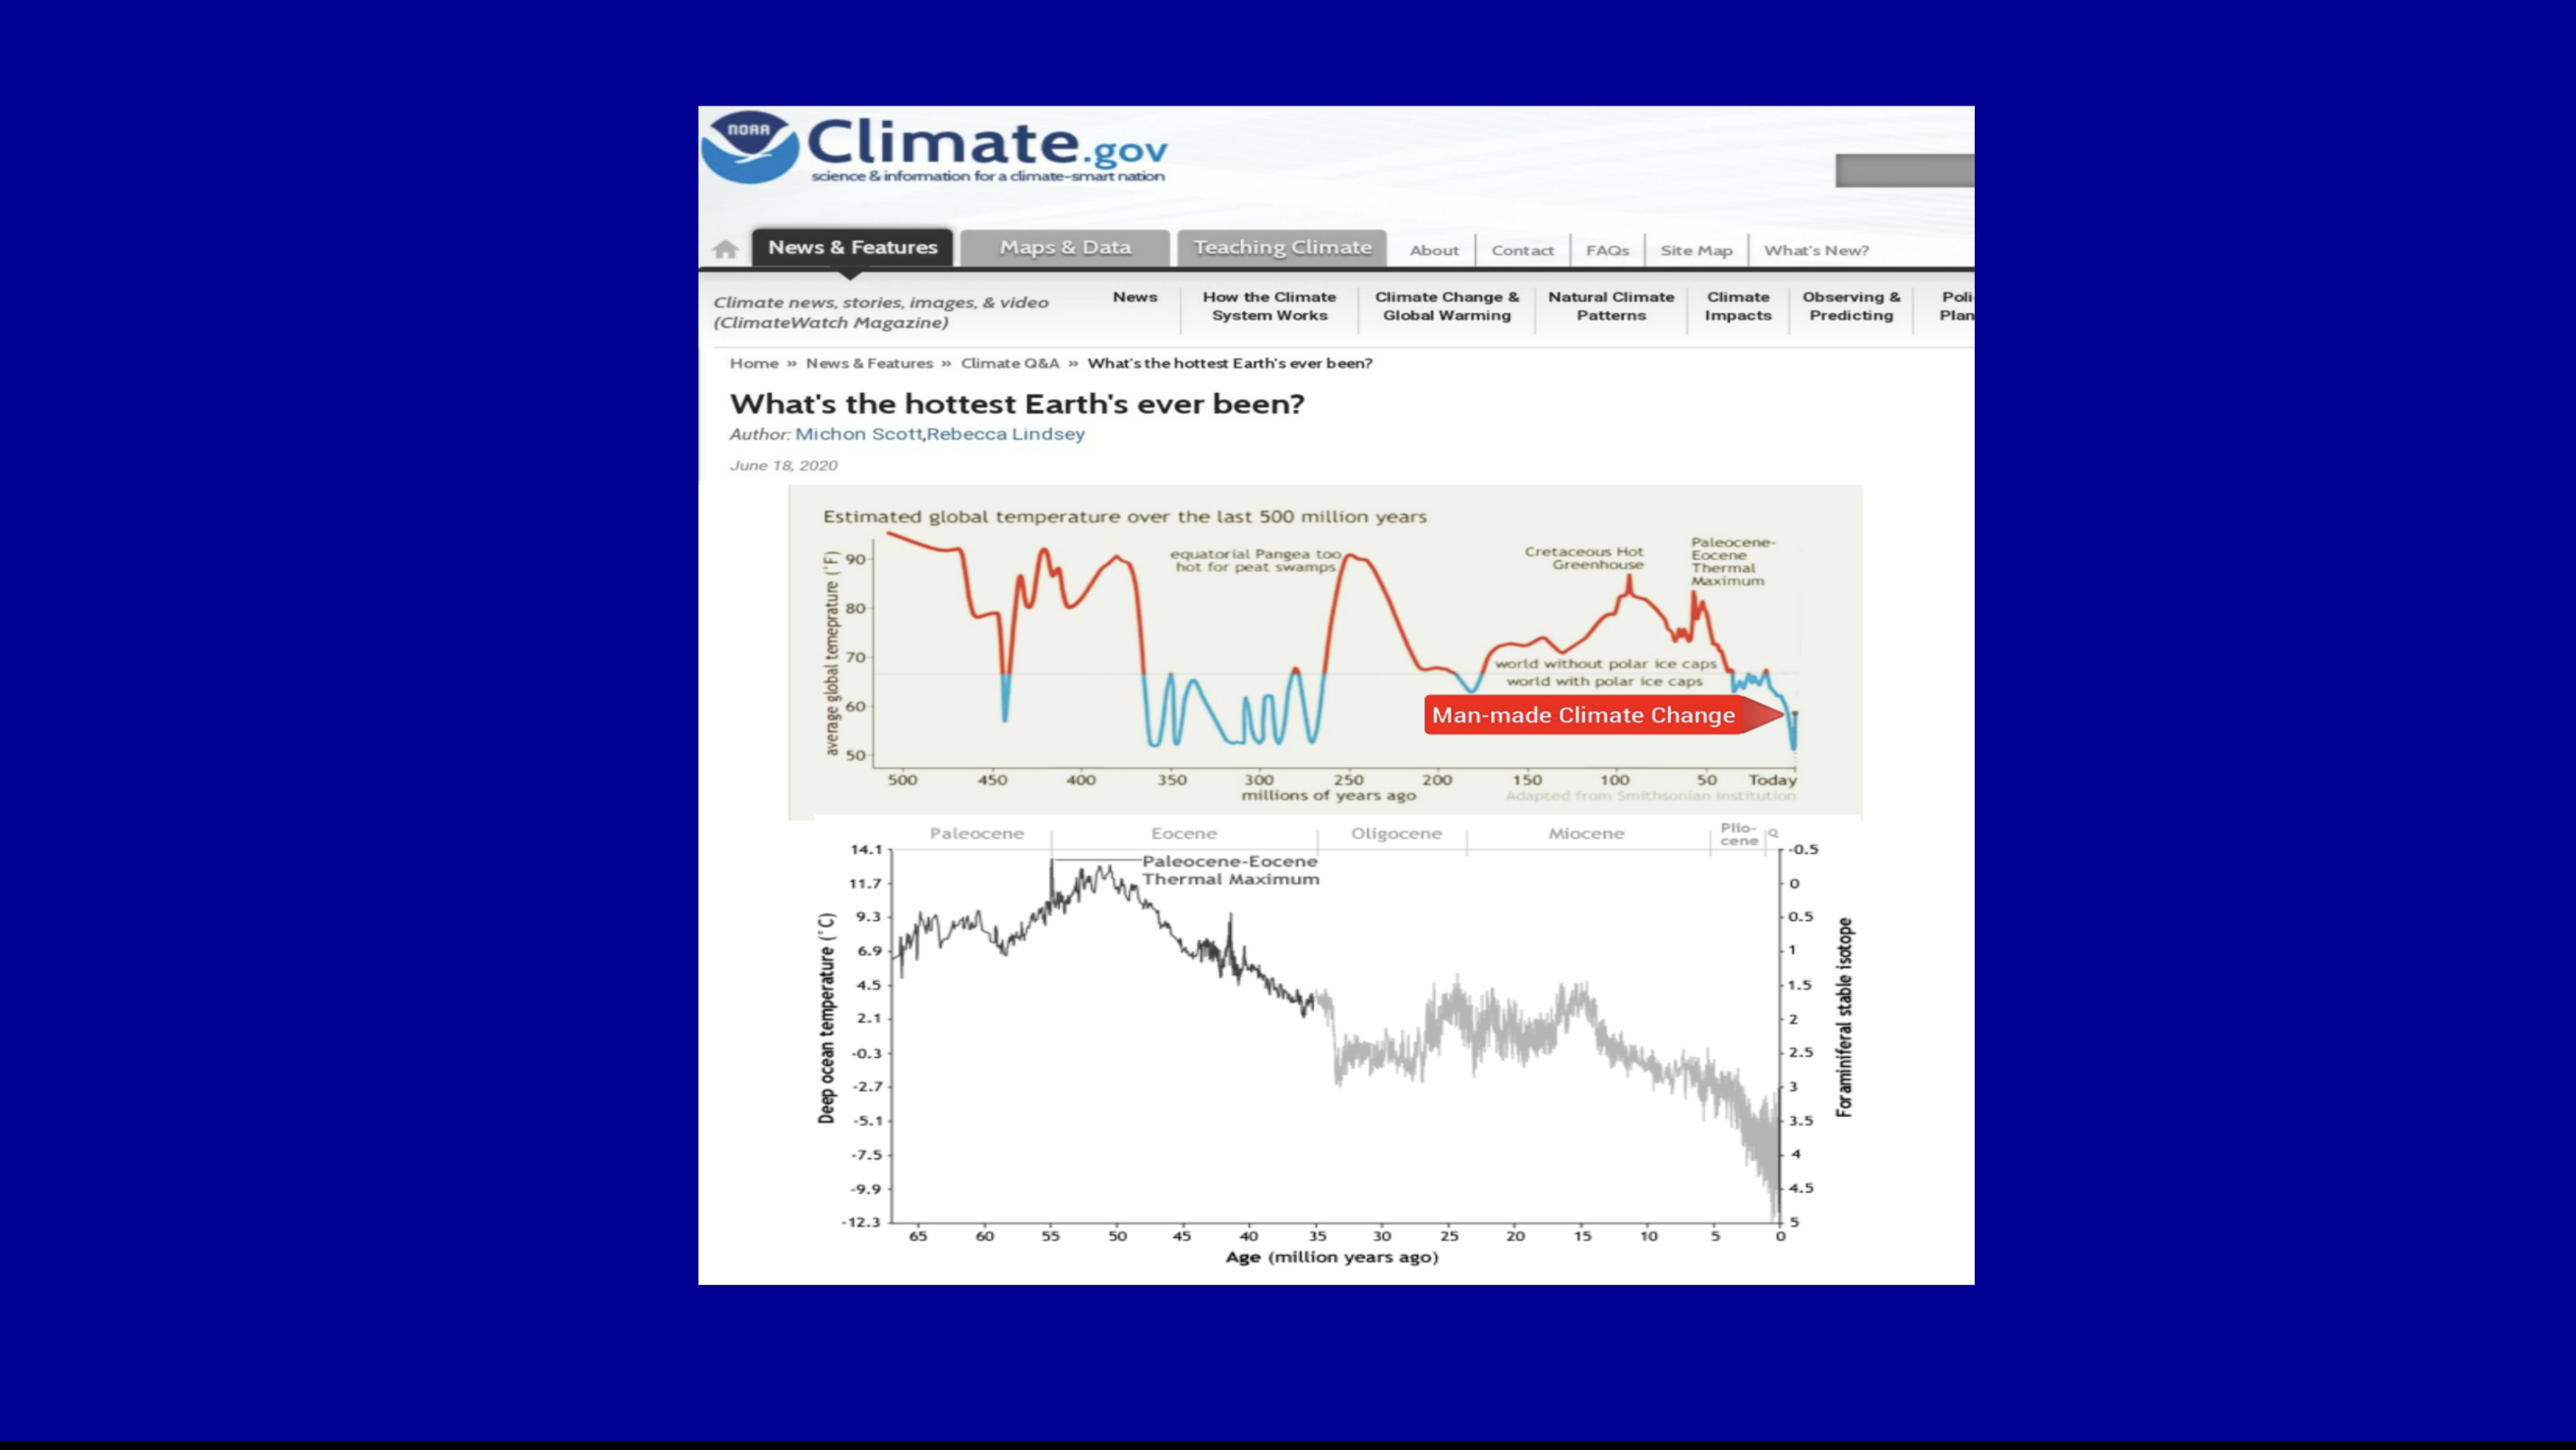
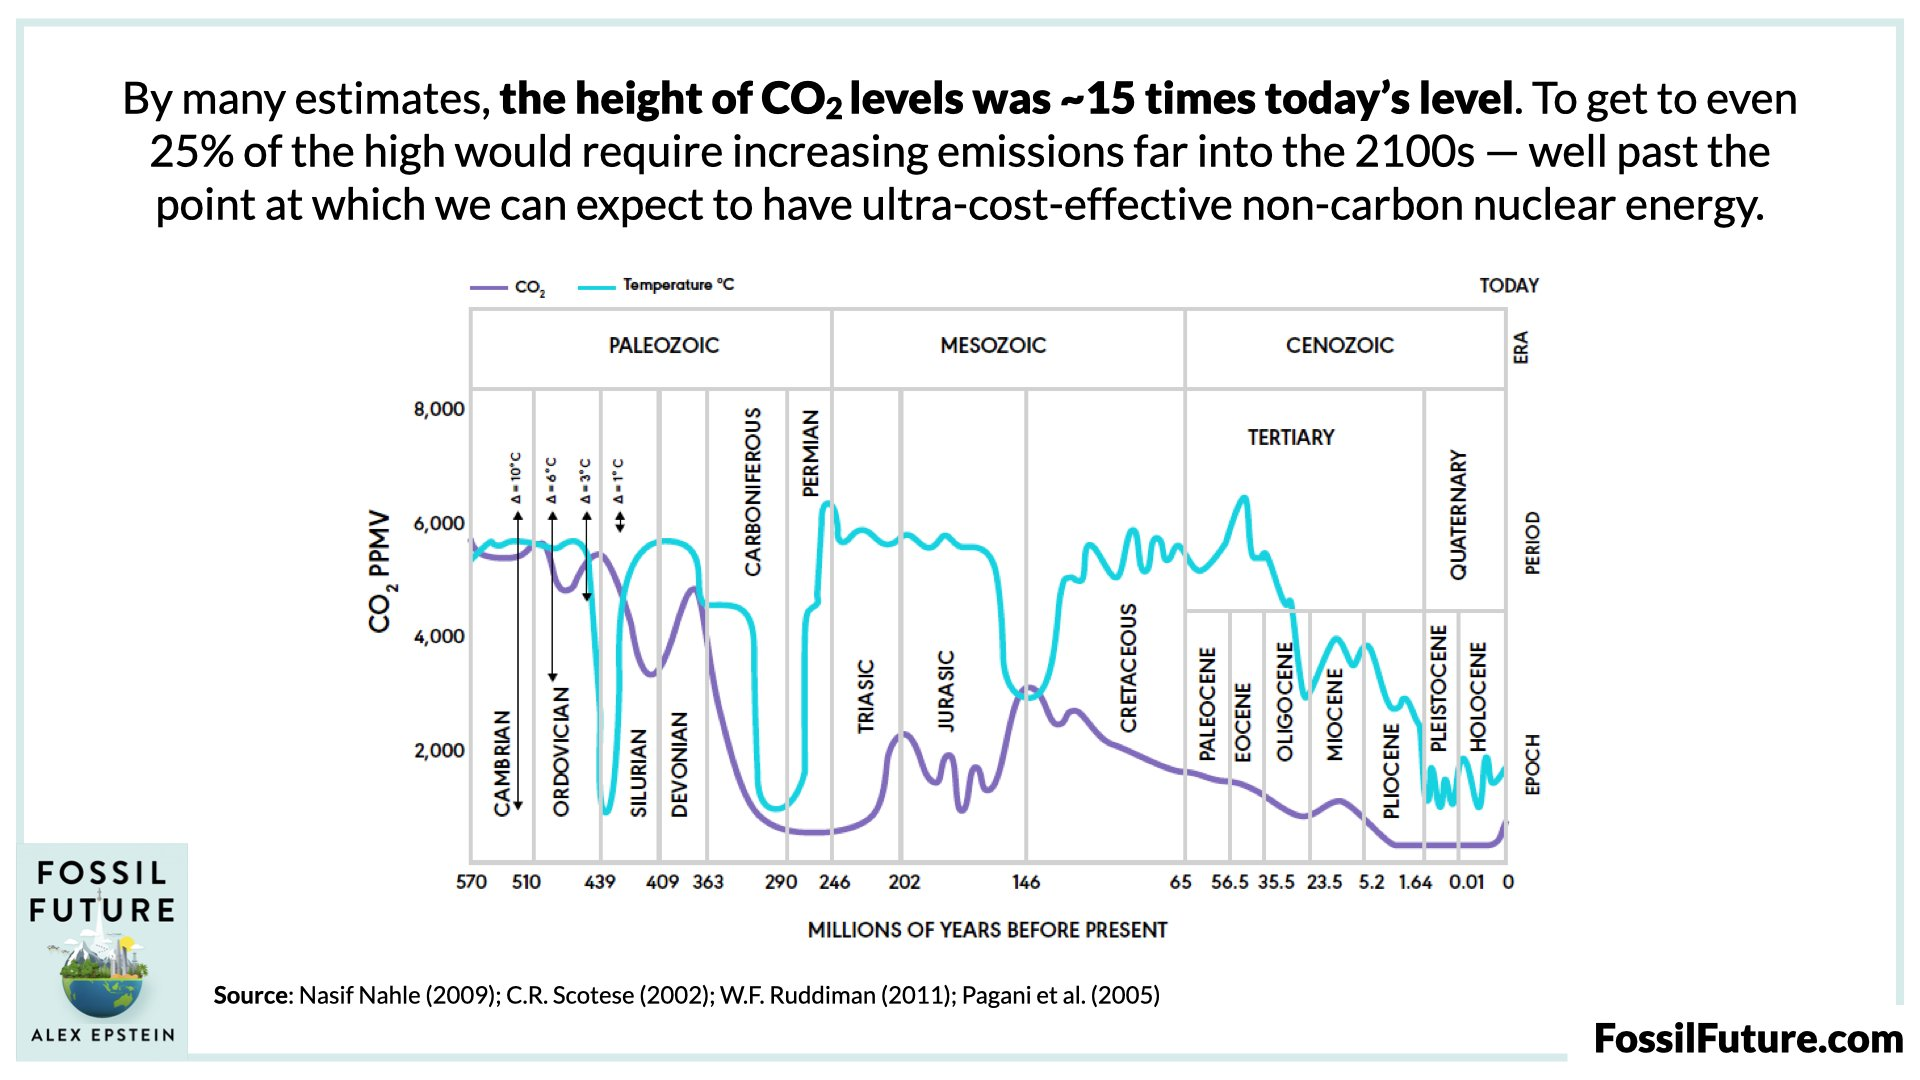
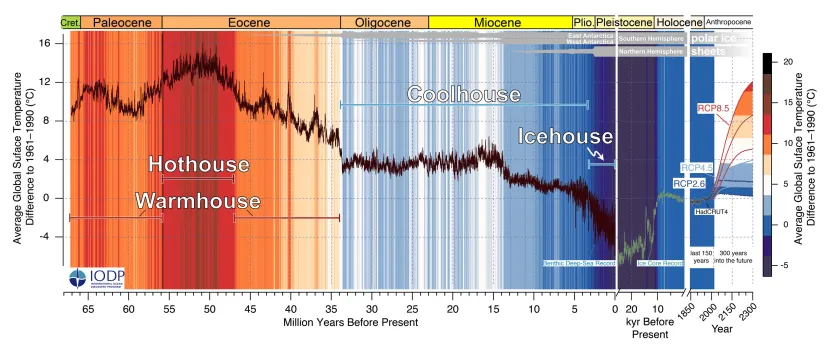
“Preliminary results from a Smithsonian Institution project led by Scott Wing and Brian Huber, showing Earth’s average surface temperature over the past 500 million years. For most of the time, global temperatures appear to have been too warm (red portions of line) for persistent polar ice caps. The most recent 50 million years are an exception.”
#
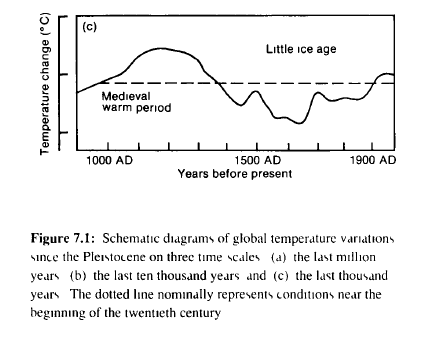
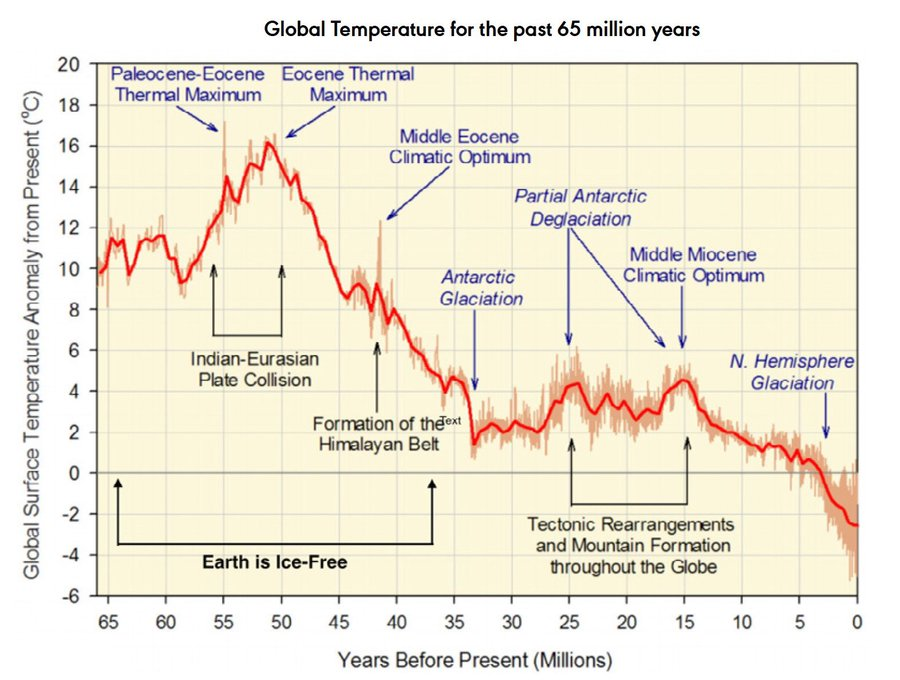
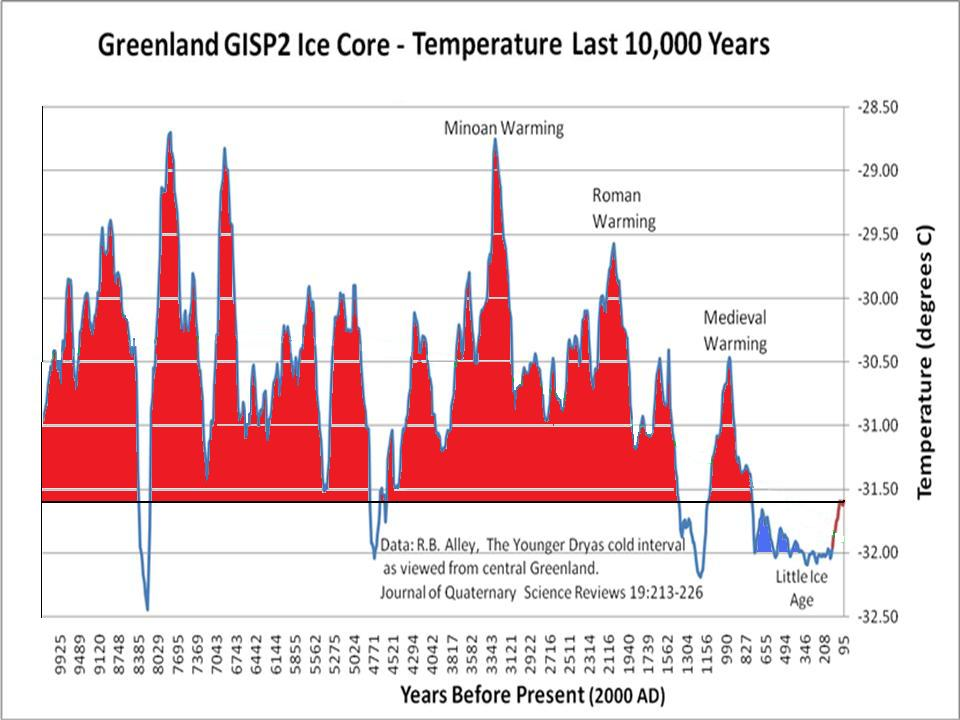
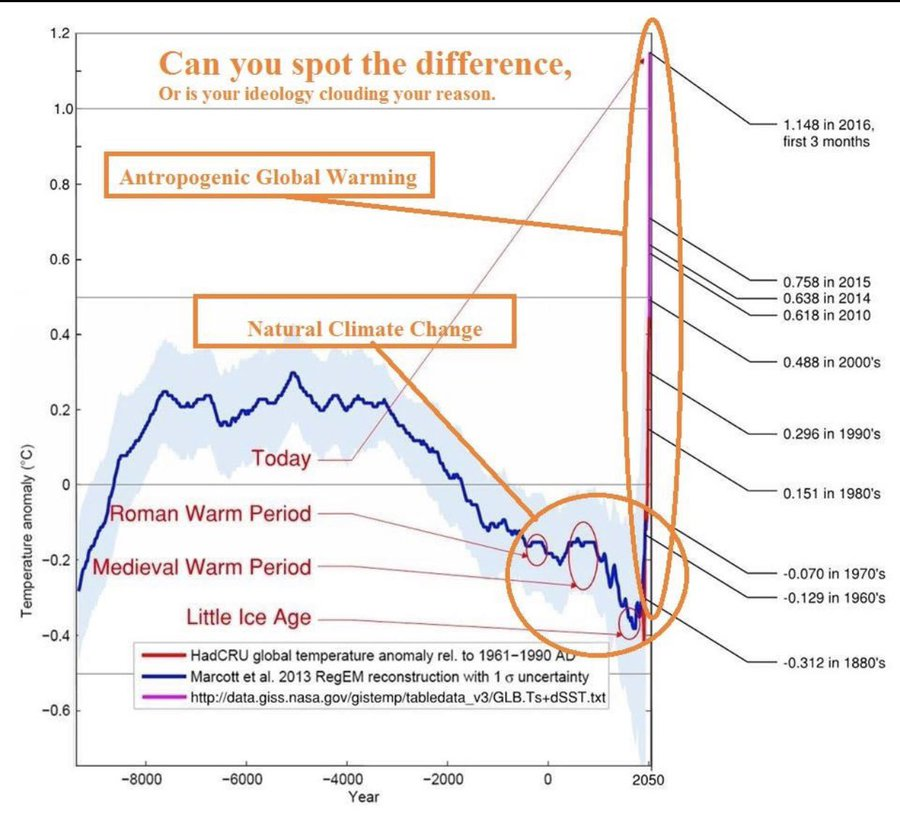
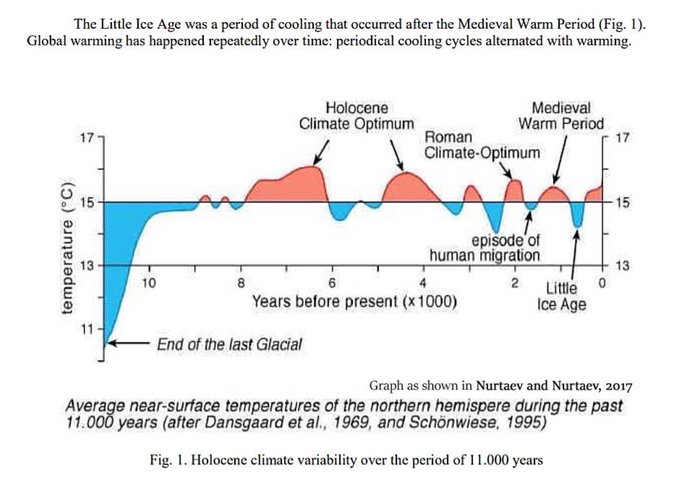
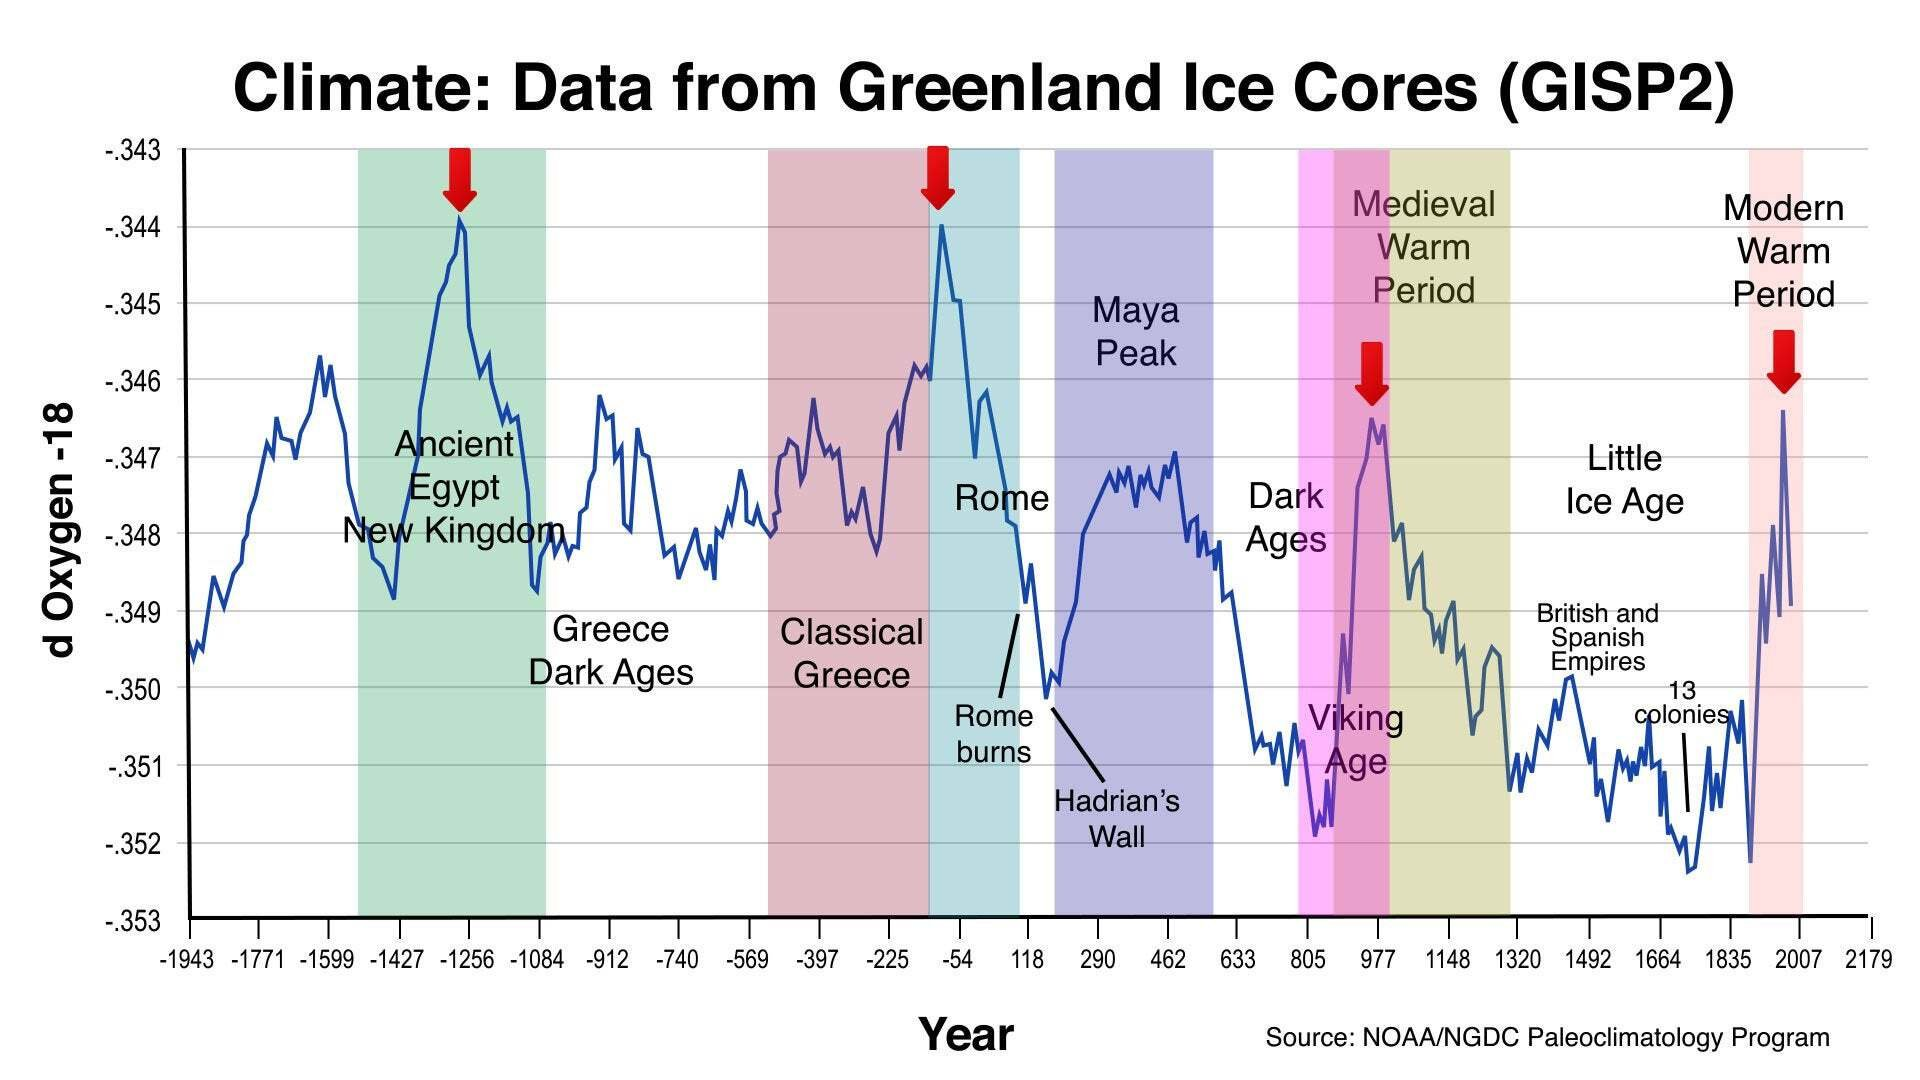
Below is a sampling of charts showing no “climate emergency.”
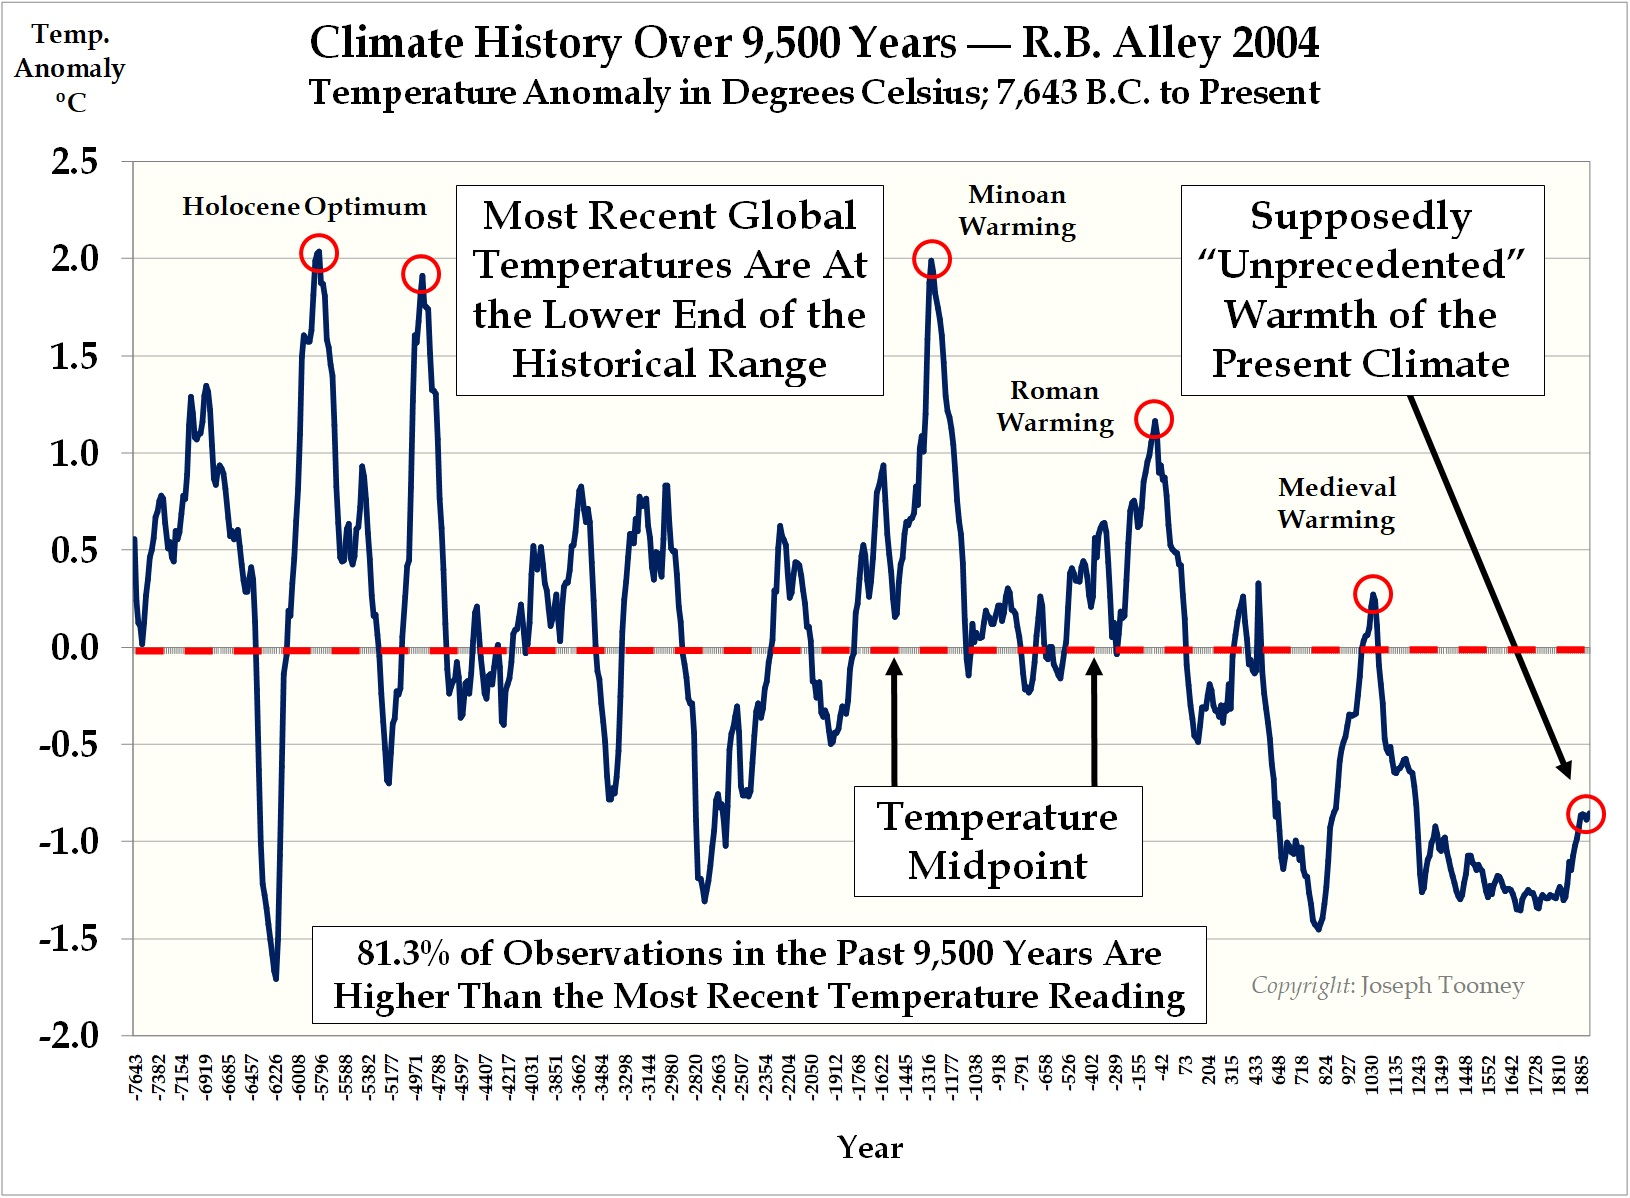
#
Below are the alternative ways to present the temperature scale to exaggerate the warming trend.

NOAA Graph: ‘As annual CO2 has risen since 1895, there has been no comparable acceleration of warming’ reports Greenpeace co-founder Dr. Patrick Moore | Climate Depot https://t.co/C7m7O2J79C pic.twitter.com/jOwdv8WUbr
— Marc Morano (@ClimateDepot) August 1, 2022


