By
The claimed warming rate during the (1998-2001 to 2012-’13) “hiatus” ranged from -0.07°C to +0.17°C per decade.
In late 2012, the IPCC had an ongoing dilemma about what to do about the uncooperative global temperatures. The HadCRUT3 data set government bureaucrats had been using since the first report in 1990 actually showed the global mean surface temperatures had been declining since 1998. This was not going further the we-must-act-on-global-warming-now narrative, of course.
Enter Phil Jones, the global temperature data set overseer at East Anglia’s Climate Research Unit (CRUTEM). He’s the scientist who famously admitted that when the temperature data doesn’t exist, they are “mostly made up.”
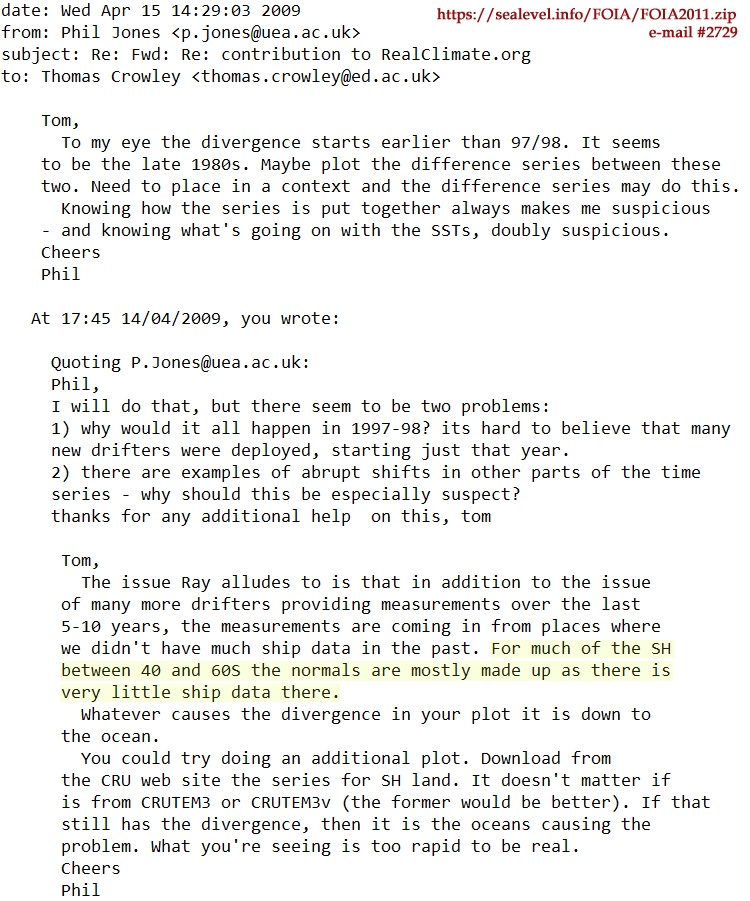
Image Source: FOIA, e-mail #2729
Jones’s CRU and the Met Office (Hadley) then jointly constructed the newer HadCRUT4 version to help advance the narrative. This version changed the data just in time for the 5th IPCC assessment (AR5, 2013). The 1998-2001 temperatures were allowed to stay the same, but an additional 0.1 to 0.2°C was tacked on to anomalies from 2002 onwards. The effect was to transform the 1998-2012 slight cooling in HadCRUT3 into a 0.04°C per decade−1 warming in HadCRUT4.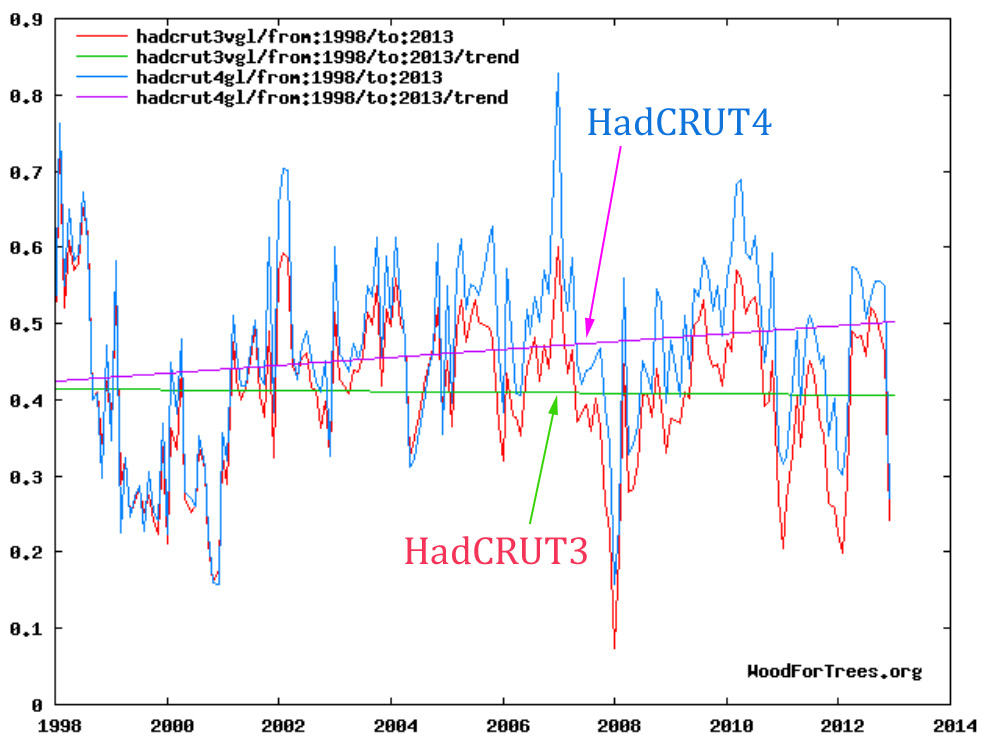
Image Source: woodfortrees.org
When the IPCC report was published months later, they admitted 111 of 114 CMIP5 modeling attempts wrongly simulated the previous 15 years of global temperature progression. That’s a 97% failure rate. But instead of embarrassingly reporting on 15 years of net cooling, the 2013 IPCC report characterized the new fangled 0.04°C per decade−1 warming trend as a global warming hiatus instead.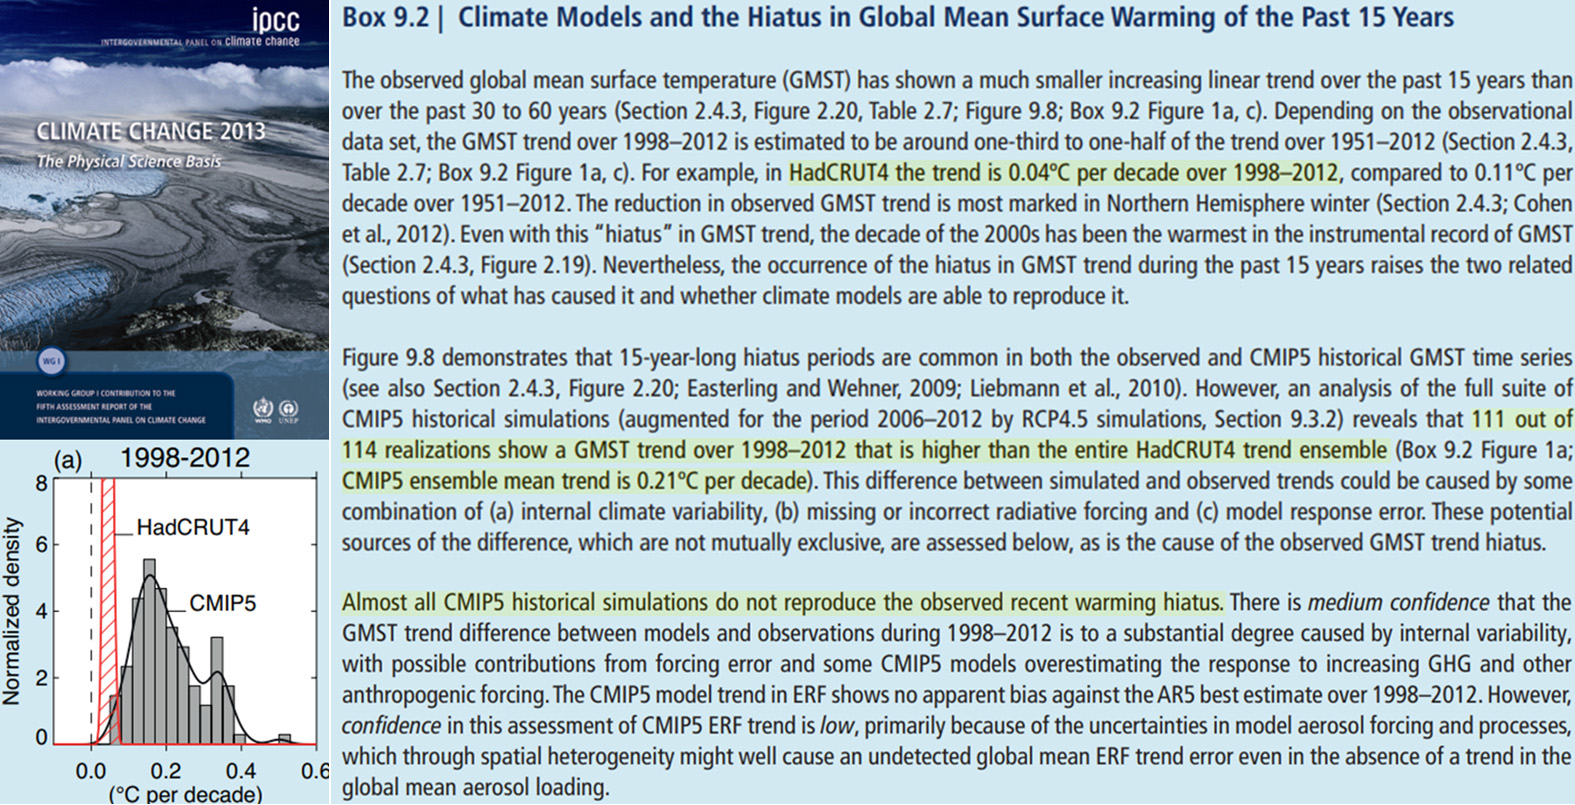
Image Source: IPCC AR5 (Chapter 9), 2013
A new study (Wei et al., 2022) commemorates the 1998-2001 to 2012-’13 “global warming slowdown” that used to be a hiatus…that used to be a cooling.
The authors reference 90 peer-reviewed scientific papers published from 2009 to 2019. Over half of these global warming pause or hiatus papers were published from 2013 to 2015.
“The warming rates greatly vary between −0.07° and 0.17°C decade−1, representing weak cooling and strong warming, respectively. This may directly induce controversies over the authenticity of the slowdown.”
Instead of settling on the already up-adjusted 0.04°C per decade−1 warming trend reported in 2013, the adjustments to the past temperature trends now double this to a 0.08°C per decade−1 warming rate (39 papers) during the “slowdown” that used to be a hiatus…that used to be a cooling.
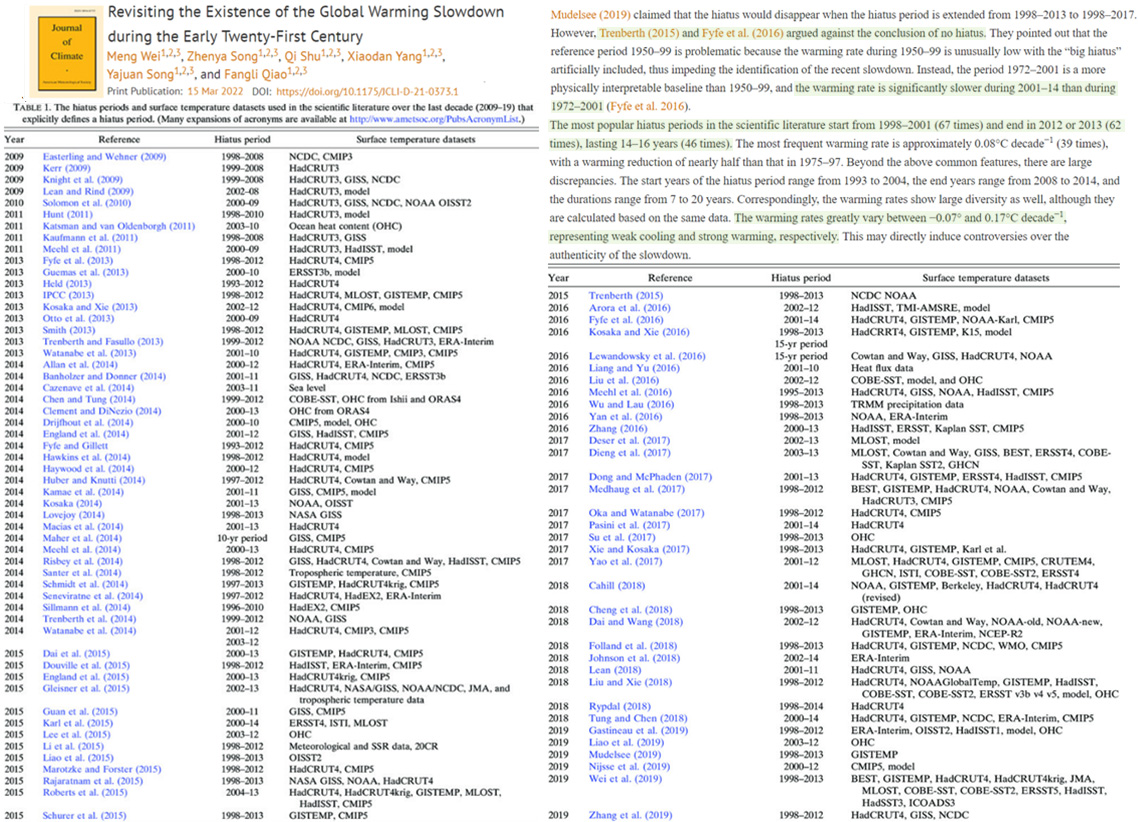
Image Source: Wei et al., 2022
HadCRUT4 temperature data now shows 8 straight years of cooling (2014 to 2022).
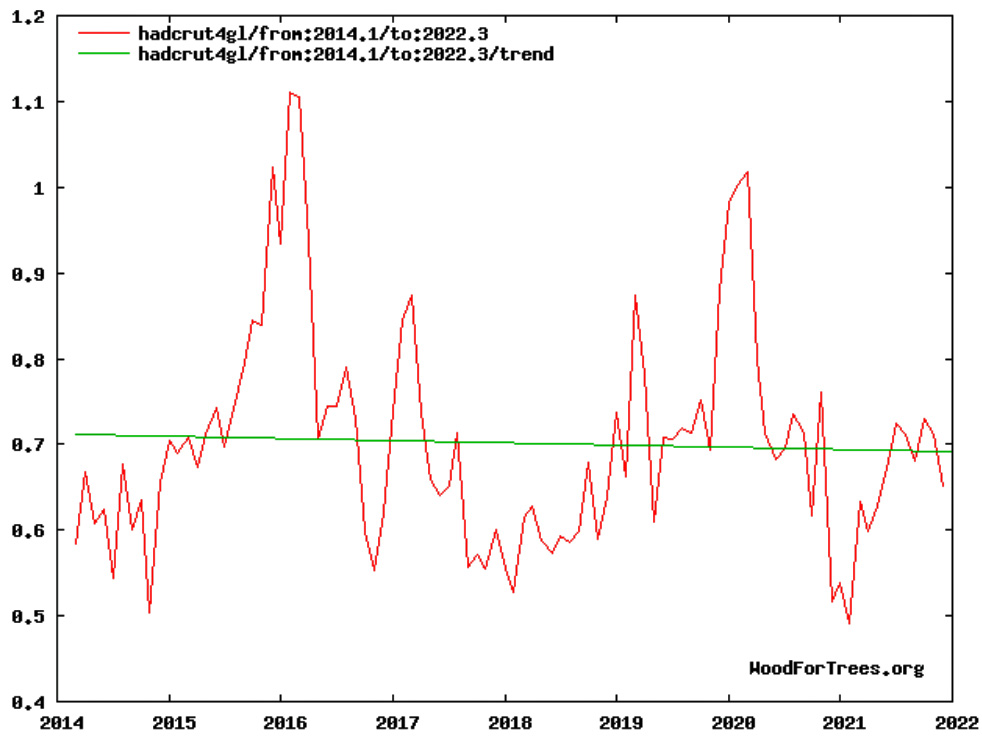
Image Source: woodfortrees.org