https://wattsupwiththat.com/2022/04/13/where-have-all-the-clouds-gone-and-why-care/
By Charles Blaisdell PhD ChE
The earth’s cloud cover has long been an important puzzle in climate change. Cloud cover has many types and varies significantly from year to year. Ground records of global cloud cover over 40 years have shown a 0.41%/decade (8) decrease in cloud cover. (A 37-year European only study (16) found a 1.4%/decade decrease). In the last 20 years, Dübal and Vahrenholt CERES satellite has data (5) that confirmed the ground observations of cloud cover decrease and a correlation with earth’s net incoming energy flux, albedo, and earth’s temperature rise. Albedo is derived from the Latin word for white, a high albedo, 1.0, is totally reflective of sun light and a low albedo, 0.0, is totally absorbent, with albedo the lower the hotter. These few pieces of data beg some questions. When did cloud cover start to decrease? Is it cyclic? How much of the of the observed global warming, GW, can be attributed to cloud cover reduction? What is causing it? Will the decrease stop? And, why should I care? Let’s start with why should I care, every 1% reduction in cloud cover could account for 1.6 W/m^2 (about 0.8’C) increase in earth’s net incoming energy flux – a significant part of all the observed GW. If this decrease started a 100 years ago and the current decrease is 0.4%/decade the total decrease over that time could be 2% or 3.2 W/m^2 (estimated 1.6’C GW) – more than the observed 2.2 W/m^2 (1.1’C GW). Sumerville and Gautier (19) in 1995 summarized that if the cloudiness of the earth decrease it would have a much greater effect on GW than doubling the CO2. In 1995 no data existed that suggested the cloud cover or relative humidity was changing over time. That is no longer true.
The first suspect in what is causing the reduction in clouds cover is green house gases, GHGs. The Dübal and Vahrenholt CERES study (5) shows a strong correlation of sun’s incoming net short wave, SW, flux (albedo) and cloud cover and little correlation to reduction of out going long wave, LW, flux and no reduction of LW top of the atmosphere, TOA, LW flux (the TOA LW flux increased). The IPCC’s theory on GHG caused GW is that: in the upper atmosphere GHGs absorb LW radiation and reflect some of the heat back to earth, like a blanket, in a process called radiative forcing, RF. The RF theory does not need a change in incoming SW radiation and RF would result in a decrease in TOA LW radiation. The IPCC’s RF theory has it’s roots in the assumption that the earths albedo does not change, from the beginning of the IPCC there was no data that said that was not true. Within the last 20 years Dübal and Vahrenholt (5), Loeb et al shows (18), and Goode et al (17) have all shown the albedo does change and it is correlated to global temperature. These studies do not match the IPCC’s RF theory – no or little GHG GW is going on in the 20 years of CERES data. Mapping of cloud cover in Loeb et al shows (18), and Figure 5, location based cloud cover changes inconsistent with uniform distribution of GHGs. Another theory is needed.
The basics of cloud formation and disappearance is temperature and relative humidity, RH (not specific humidity, SH) (13), (14), and (15). Clouds form with combinations of lowering temperature and higher RH approaching the dew point; and disappear with combinations of higher temperatures and lower RH moving away from the dew point. Cold air meeting warm humid air is the most common way clouds are formed. Another example of cloud formation is air rising over a mountain range where the pressure decrease causes the temperature to decrease and RH increasing toward the dew point. Clouds can’t form or are dissipated when air moves over hot low RH deserts. In a rain forests the many leaves on the trees make hot most air which rises to where the pressure reduces the temperature to the dew point. All these examples are natural occurring weather events. Has man or nature made any change in the earth that would cause the temperature to increase and the RH to decrease that could affect cloud formation? More desert would do the job – maybe drought in Africa. Forest fires create unvegetated black land that would produce hot low RH air; but at a low percentage of the land mass of the earth (about 0.07%). To be a significant impact on cloud formation a new ( over the last 100-150 years) larger area producing hot low RH air is needed.
Since 1700-1880 man has made some small changes in land use albedo but a large change in the land area. Most of these albedo changes came along with an unintentional decrease in moisture availability due to reduced vegetation, buildings, pavement, or exposed land. Most notable are Urban Heat Islands, UHIs, increasing to about 3% of the earth’s land mass for all cities. Go to any city at (1), see Figure 1, and you can find the daytime data for temperature vs RH, in the morning the RH is high and as the day progress the temperature rises and the RH drops sometimes to 40% RH or lower, this is a normal psychrometric thermodynamic process, see (10), for an interactive psychometric chart (and Figure 2 for a picture of a psychrometric chart, these charts are used to solve the complicated thermodynamics of air/water mixtures). These cities can have a daily temperature rise of up to 8’C higher than their rural counterpart. A large part of this temperature rise is due to the sensible heat psychometric rise (no water added just heat) in temperature while the RH drops, shown as “theory” in Figure 2. Most UHIs follow the “theory” slope indicating no or little water is added to the air in a UHI. The heat driving this temperature rise is the heat from the sun and the albedo of the UHI. Most UHIs have low albedos (about 0.05) vs the virgin land they replaced (about 0.15). While this albedo difference (0.10) has a low significance in GW (about 0.16 W/m^2) the UHI’s albedo drives the production of low RH hot air. The virgin land produced cooler higher RH air. This is a big change from cloud cover point of view.
There is one more source of low RH hot air. Globally the change since 1880 from virgin land to crop/pasture was about 6% of the earths land mass with a slightly higher (cooler) change in albedo (3); but, with unexpected lower moisture and hotter air than the virgin land. The most notable of these changes was the deforestation of the Amazonian rain forest to make crop and pasture land (4). Costa et al (4) showed that despite an increase in albedo from rain forest to crop/pasture the temperature increase, the RH deceased, the cloud cover decreased, and the rain decreased. This is a classic example of psychometric temperature and RH behavior. Combining the UHI and crop/pasture land changes we get 9% of the earth’s land mass producing more hot low RH air than 1700-1880.
With two source of hot low RH air where does it go and what does it have to do with clouds? To show examples of UHI and crop/pasture land changes that change RH, temperature, dew point and cloud ceiling we will use the data in Table 1 for 5 cases, data from (10). To keep the cases comparable, all cases start with the same conditions, Case 1. A base Case 2, simulation of a rain forest, heat (sun) input of 8.0 kJ/kg(da) difference (end-start), typical of average UHIs. Water addition of 2g/kg(da) is a typical rain forest SH increase. Case 3 show what happens with no water added from evaporation or plant transpiration in Amazonia (like a UHI with rain forest albedo in Amazonia). Case 4 simulates a UHI with lower albedo (more heat) and no water from evaporation or plant transpiration, typical of most big cities. Case 5 simulated cropland with higher albedo (less heat) and no water addition typical of what happened in Amazonia.
Table 1, Psychrometric Chart Cases to Simulate Range of CRGW Cases.
| T.Dry.Bulb | Spec, Humidity SH | Rel.Humid RH | T.Dew | enthalpy difference (albedo) | cloud celling | ||
| simulation | °C | g/kg(d.a) | % | °C | kJ/kg(d.a) | m | |
| Case 1 | start of day condition for all cases | 25.0 | 16.1 | 80.3 | 21.4 | na | na |
| calculated end of day conditions | |||||||
| Case 2 | Rain Forest (water needed to simulate trees and wet conditions) | 27.9 | 18.1 | 75.5 | 23.2 | 8.0 | 561 |
| Case 3 | Base Case no water (sensiable heat rise only) UHI with same albedo as case 2 | 32.6 | 16.1 | 52.1 | 21.4 | 8.0 | 1318 |
| Case 4 | UHI with lower albedo | 34.4 | 16.1 | 46.8 | 21.4 | 9.7 | 1543 |
| Case 5 | crop/pasture land with higher albedo | 31.3 | 16.1 | 55.8 | 21.4 | 6.4 | 1171 |
variable changed: bold
input variable: green
calculated results: blue
The air above the UHI or crop/pasture land is hot and dryer and it rises all day long, creating a plume of rising hot low humidity air. That plume of air moves with the prevailing winds usually to the east in a circling pattern due to the Coriolis effect. The picture from (6), Figure 4, shows the extent of the UHI plume from Chicago, Il. This is a computer model tuned with real data and calculates the extent of the plume to be 2 to 4 time the area of the UHI. The model also predicts the shape of the plume, rising to where low clouds could be, and bypassing mixing with the lower atmosphere like a hot air balloon. Using 3 times as the average extent of the plume we now get 27% of the land mass (7.8% of the earth) possibly being affected by plumes like the one in Figure 4, with properties between Case 4 and 5 in Table 1. Most likely only a small part of this hot low RH air prevents or destroys cloud cover; but, a small part is all that is needed. Windy or stormy days would destroy this plume and greatly reduce its cloud prevention potential.
Burch (11) has a correlation used by airplane pilots to predict cloud ceiling.
Cloud ceiling (m) = (ground temp.’C – ground dew point %)*119
This correlation is added to Table 1 cases to show that the man-made changes to land can make significant change in cloud ceiling. This is a correlation using real ground data and cloud ceiling observations and suggest that the hot/dry air from case 3, 4 and 5 in Table 1 do rise to high altitudes as predicted in the (6) model, Figure 4.
Cloud ceiling increase is not cloud cover decrease and is not specific to UHIs or cropland; but it should be related to cloud prevention. It has long been recognized that cloud cover and RH are positively related – increased RH is correlated to increased cloud cover (vis/vis), (13), (14), and (15). Since there are many types of clouds and elevations, predicting cloud cover probably requires multiple variables to model. Attempts at Global Circulation Models, GCM for cloud effect have been going on for a long time, and 1995 summary of GCMs for the IPCC is contained in Sumerville and Gautier (19), where the difficulty of modeling clouds is summarized. Currently no GCM has made a good model of cloud cover; but all model attempts agree that RH is the key variable, lower RH = less clouds especially low-level clouds. Walcek at page 23 and page 24 in Sumerville and Gautier (19), (page 23), shows a graph of many sources of ground observation on cloud cover vs RH, the graph show a wide range of data with an exponential decline. This observation by Walcek (19) is summarized in Figure 1. When the plume of hot low RH air in Figure 4 is 80%RH – 60%RH it has less cloud formation ability (7) and (Figure 1); and, below 60% RH very few clouds form. Ground observation data (8) shows a 0.41%/decade decrease in clouds over 40 years. Figure 9 in (5) shows about 0.57%/decade decrease. European 37 years of data (16) shows 1.4%/decade.
UHI plumes can also affect approaching thunder storms (20), the hot rising air is displaced by lower cooler air associated with the thunder storm and moves the storm toward the UHI over the UHI the storm can mix with the hot air and break into smaller cells, but the storm reforms after passing the UHI. UHIs and storms are a studied variable in the IPCC reports, but not given any significance. The low RH hot air from UHI or cropland in non storm or cloudy conditions is not studied in the IPCC reports.
Global maps of study variables in Loeb et al (18) show that the changes in heat flux (W/m^2) are not evenly distributed for all variables. Cloud cover and humidity stand out (18) as localized changes over the 20 years of study. The cloud cover change in heat flux is most noted downwind of UHI areas and the humidity increase in heat flux is located in the converted Amazonia crop land. One other noted area of cloud change is the dark change in the Pacific Ocean which is the known Pacific Decadal Oscillation (PDO) temperature oscillation. The PDO is an oscillation not an increase with each oscillation and shows the good sensitivity of the analysis of the CERES data.
This coming and going of clouds is a normal event in the earths weather. A 0.4%/decade cloud change or 1.5 more days of clear sky per decade in enough to account for the albedo change in Dübal and Vahrenholt , (5), CERES data.
We now have a new theory: cloud reduction global warming, CRGW: Man’s changes to land use causes the production of low relative humidity hot air rising to where clouds could be prevented (or destroyed) thus reducing the albedo of the earth
In other words: man’s growing changes to land use (rain forest to farm land, and city area expansion) have reduced the cloud producing moisture that used to naturally rise from the virgin land.
Looking for data signatures of CRGW: temperature rising and RH decreasing. See Figure 3, (2), temperature anomalies, SH, and RH all plotted together vs time, we see they are all correlated (Temp and SH positively, and Temp and RH negatively). If CRGW were not occurring on a global basis the SH would be increasing to be in equilibrium with the temperature and the RH would be flat, GRGW theory causes temperature and RH to diverge.
An 1870 to 2015 (145 years) record of RH in Moscow (12) show a steady decrease in RH over time at 0.58%RH/decade, Moscow may not be representative of all the earth’s UHI’s but it shows that the CRGW theory has been occurring for a long time. The decrease in RH and constant SH over time is the signature of a change in a UHI heating without adding water vapor to the heated area.
In the Dübal and Vahrenholt , (5), CERES study the earth’s energy imbalance, EEI, is missing about 0.77W/m^2 of energy. This energy most likely went into the ocean to be released latter (over about 80 years). If the CRGW theory is correct man’s population will increase as well as the land’s producing low RH hot air which leads to cloud reduction. Adding the energy stored in the ocean to new cloud cover reductions the CRGW theory can easily get to the temperature rise predictions of IPCC’s RF theory without GHGs.
The reduce cloud cover exposes more land and ocean to the sun. The effect on GW can now be calculated; or should Anthropical Global Warming, AGW be used since CRGW is man made. The targets of the exposed land and ocean are located in the middle 75% of the earth where the cloud cover is about 50% vs about 60% for the whole earth, (also assuming albedo of clouds is 50%). The sun’s flux to this exposed area is the cloud free flux of 342 W/m^2 (1367/4). Dübal and Vahrenholt (5) suggest this energy is split 85% over ocean (0.05 albedo) and remainder over land (0.15 albedo). Using Eastman’s et al (8)’s cloud cover (0.41%/decade) for 2 decades of CERES data we get and albedo flux change of 1.3W/m^2, the same as observed by Dübal and Vahrenholt (5), see table 2. The CRGW theory is plausible. Expanding these assumptions in the CRGW theory to 2.0% cloud cover reduction over 100years will give 3.2W/m^2. More than the IPCC’s estimated 2.2 W/m^2 (1.1’C GW) albedo change since 1880. Some of the excess energy will be stored in the ocean for later release.

Table 2
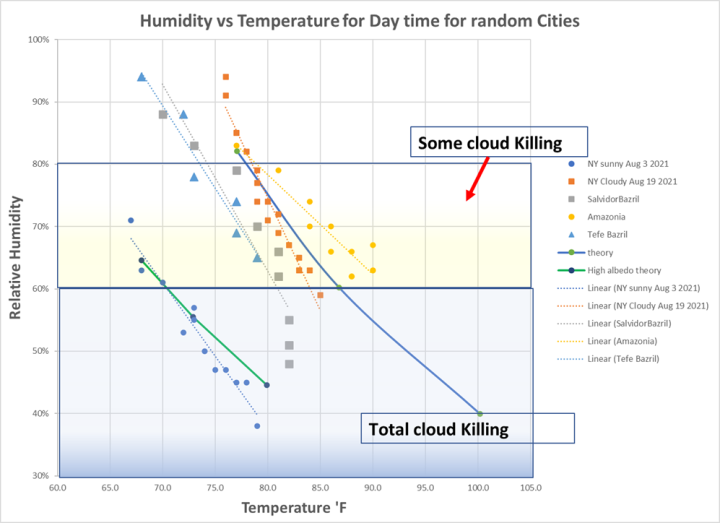
Figure 1 from (1) data

Figure 2 (10) example
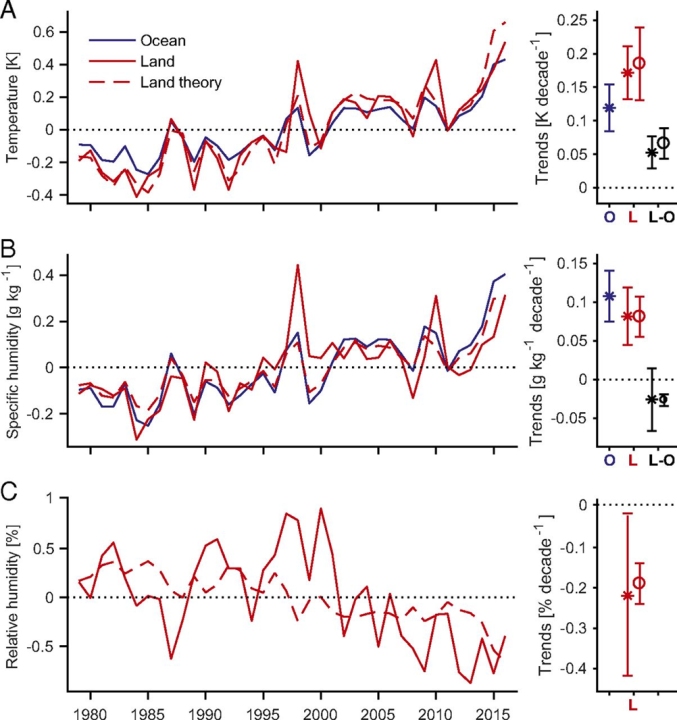
Figure 3 from (2)

Figure 4 from (6)

Figure 5 from (18) “Attribution of Clouds and the Earth’s Radiant Energy System net top-of-atmosphere flux trends for 2002/09–2020/03. Shown are trends due to changes in (a) clouds, (b) surface, (c) temperature, (d) combined contributions from trace gases and solar irradiance (labeled as “Other”), (e) water vapor, and (f) aerosols. Positive trends correspond to heat gain and negative to loss. Stippled areas fall outside the 5%–95% confidence interval. Numbers in parentheses correspond to global trends and 5%–95% confidence intervals in W m−2 decade−1.”
Bibliography
- “Timeanddate” web link: timeanddate.com
- “Trends in continental temperature and humidity directly linked to ocean warming” by Michael P. Byrne and Paul A. O’Gorman web link: Trends in continental temperature and humidity directly linked to ocean warming | PNAS
- “Global albedo change and radiative cooling from anthropogenic land cover change, 1700 to 2005 based on MODIS, land use harmonization, radiative kernels, and reanalysis” by Bardan Ghimire,Christopher A. Williams,Jeffrey Masek,Feng Gao,Zhuosen Wang,Crystal Schaaf,Tao Web link: Global albedo change and radiative cooling from anthropogenic land cover change, 1700 to 2005 based on MODIS, land use harmonization, radiative kernels, and reanalysis – Ghimire – 2014 – Geophysical Research Letters – Wiley Online Library
- Climate change in Amazonia caused by soybean cropland expansion, as compared to caused by pastureland expansion by: Marcos H. Costa,Silvia N. M. Yanagi,Paulo J. O. P. Souza,Aristides Ribeiro,Edson J. P. Rocha First published: 10 April 2007 https://doi.org/10.1029/2007GL029271 Web link: agupubs.onlinelibrary.wiley.com/doi/full/10.1029/2007GL02927
- “Radiative Energy Flux Variation from 2001–2020” by Hans-Rolf Dübal 1,* and Fritz Vahrenholt 2ORCID web link: Atmosphere | Free Full-Text | Radiative Energy Flux Variation from 2001–2020 | HTML (mdpi.com)
- “Downwind footprint of an urban heat island on air and lake temperatures” by Ann Cosgrove & Max Berkelhammer web link Downwind footprint of an urban heat island on air and lake temperatures | npj Climate and Atmospheric Science (nature.com)
- Cloud Cover and Its Relationship to Relative Humidity during a Springtime Midlatitude Cyclone by Chris J. Walcek1 web link: Cloud Cover and Its Relationship to Relative Humidity during a Springtime Midlatitude Cyclone in: Monthly Weather Review Volume 122 Issue 6 (1994) (ametsoc.org)
- “Climatic Atlas of Clouds Over Land and Ocean” by Ryan Eastman, Stephen G. Warren, and Carole J. Hahn web link: Climatic Atlas of Clouds Over Land and Ocean (uw.edu)
- “Temporal–Spatial Patterns of Relative Humidity and the Urban Dryness Island Effect in Beijing City” by Ping Yang, Guoyu Ren, and Wei Hou web link: Temporal–Spatial Patterns of Relative Humidity and the Urban Dryness Island Effect in Beijing City in: Journal of Applied Meteorology and Climatology Volume 56 Issue 8 (2017) (ametsoc.org)
- “Free Online Interactive Psychrometric Chart” by Free Online Interactive Psychrometric Chart web link: Free Online Interactive Psychrometric Chart (flycarpet.net)
- “Relative Humidity and Dew Point as a Function of Altitude — A Way to Estimate Cloud Ceilings” by David Burch Navigation Blog web link: David Burch Navigation Blog: Relative Humidity and Dew Point as a Function of Altitude — A Way to Estimate Cloud Ceilings
- “Urban Heat Island and Urban Dry Island in Moscow and Their Centennial Changes” by Mikhail A. Lokoshchenko web link; Urban Heat Island and Urban Dry Island in Moscow and Their Centennial Changes in: Journal of Applied Meteorology and Climatology Volume 56 Issue 10 (2017) (ametsoc.org)
- “Cloud Cover and Its Relationship to Relative Humidity during a Springtime Midlatitude Cyclone” by Chris J. Walcek1 web link Cloud Cover and Its Relationship to Relative Humidity during a Springtime Midlatitude Cyclone in: Monthly Weather Review Volume 122 Issue 6 (1994) (ametsoc.org)
- “Clouds and relative humidity in climate models; or what really regulates cloud cover?” by Walcek, C. web link Clouds and relative humidity in climate models; or what really regulates cloud cover? (Technical Report) | OSTI.GOV
- “The Relationship between Cloud Cover to Temperature and Humidity” by Llyn L. Escarcha And Ashanti F. Pangue web link 5c1db298-1dd3-4fb1-8e40-daa3464dbcaa (globe.gov)
- “Clouds and sunshine duration” by Climate Change Service web link Clouds and sunshine duration | Copernicus
- “Earth’s Albedo 1998–2017 as Measured From Earthshine” by P. R. Goode,E. Pallé,A. Shoumko,S. Shoumko,P. Montañes-Rodriguez,S. E. Koonin First published: 29 August 2021 https://doi.org/10.1029/2021GL094888 web link: Earth’s Albedo 1998–2017 as Measured From Earthshine – Goode – 2021 – Geophysical Research Letters – Wiley Online Library
- “Satellite and Ocean Data Reveal Marked Increase in Earth’s Heating Rate” by Norman G. Loeb,Gregory C. Johnson,Tyler J. Thorsen,John M. Lyman,Fred G. Rose,Seiji Kato web link Satellite and Ocean Data Reveal Marked Increase in Earth’s Heating Rate – Loeb – 2021 – Geophysical Research Letters – Wiley Online Library
- “Elements of Change, Climate-Radiation Feedbacks: Current state of the science. “ by Richard C. J. Sumerville et al web link https://www.osti.gov/servlets/purl/232611/ Page 23 and 24 for Chris Walcek paper
- “Urban-induced thunderstorm modification in the Southeast United States” by Walker S. Ashley & Mace L. Bentley & J. Anthony Stallins web link Ashley et al. 2012 CC.pdf (niu.edu)