https://notalotofpeopleknowthat.wordpress.com/2021/10/13/inconvenient-tornado-data-disappears/
By Paul Homewood
For years NOAA have included this page on the tornado section of their website:
One of the main difficulties with tornado records is that a tornado, or evidence of a tornado must have been observed. Unlike rainfall or temperature, which may be measured by a fixed instrument, tornadoes are short-lived and very unpredictable. If a tornado occurs in a place with few or no people, it is not likely to be documented. Many significant tornadoes may not make it into the historical record since Tornado Alley was very sparsely populated during the 20th century.
Much early work on tornado climatology in the United States was done by John Park Finley in his book Tornadoes, published in 1887. While some of Finley’s safety guidelines have since been refuted as dangerous practices, the book remains a seminal work in tornado research. The University of Oklahoma created a PDF copy of the book and made it accessible at John Finley’s Tornadoes.
Today, nearly all of the United States is reasonably well populated, or at least covered by NOAA’s Doppler weather radars. Even if a tornado is not actually observed, modern damage assessments by National Weather Service personnel can discern if a tornado caused the damage, and if so, how strong the tornado may have been. This disparity between tornado records of the past and current records contributes a great deal of uncertainty regarding questions about the long-term behavior or patterns of tornado occurrence. Improved tornado observation practices have led to an increase in the number of reported weaker tornadoes, and in recent years EF-0 tornadoes have become more prevelant in the total number of reported tornadoes. In addition, even today many smaller tornadoes still may go undocumented in places with low populations or inconsistent communication facilities.
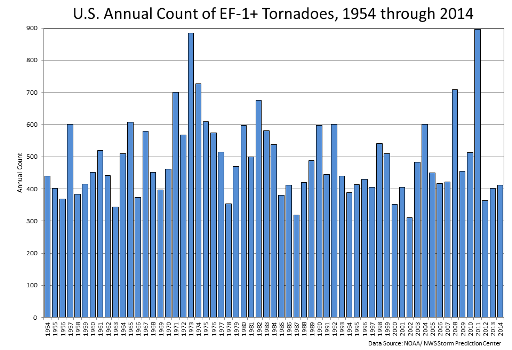
With increased National Doppler radar coverage, increasing population, and greater attention to tornado reporting, there has been an increase in the number of tornado reports over the past several decades. This can create a misleading appearance of an increasing trend in tornado frequency. To better understand the variability and trend in tornado frequency in the United States, the total number of EF-1 and stronger, as well as strong to violent tornadoes (EF-3 to EF-5 category on the Enhanced Fujita scale) can be analyzed. These tornadoes would have likely been reported even during the decades before Doppler radar use became widespread and practices resulted in increasing tornado reports. The bar charts below indicate there has been little trend in the frequency of the stronger tornadoes over the past 55 years.
#
Paul Homewood comments:
It is absolutely clear that the number of strong tornadoes has declined since the 1970s.
Alarmingly, however, this page has been “disappeared”, and the link now comes up with this:
https://www.ncdc.noaa.gov/societal-impacts/tornadoes/
There is no discussion whatsoever of changes in reporting methodology, or any of the detailed work done by earlier scientists.
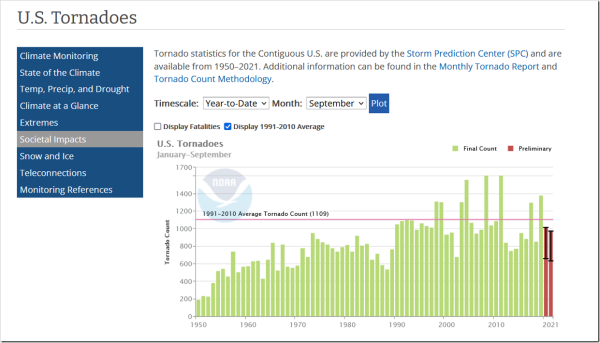
All we have is the chart, along with a table, which dishonestly claims that tornadoes have become progressively more common.
Fortunately Wayback still has a copy of the original web page, and I also have it on file.
It is blindingly apparent that NOAA found their original assessment far too inconvenient, something that should be kept out of the public domain at all cost.
To be fair, it is problematic comparing historical data with today’s, when reporting methodology and techniques have changed so much.
But this does not stop NOAA from pretending they know what global temperatures were 150 years ago, or comparing current hurricane trends with pre-satellite counts, or claiming to know the size of the Greenland ice cap in the 1930s!
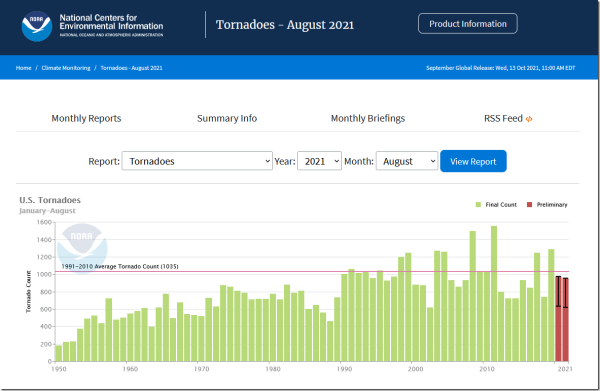
But if the historical data for tornadoes is so unreliable, how can they possibly justify publishing graphs like this every month?
https://www.ncdc.noaa.gov/sotc/tornadoes/202108
This is not “scientific”. It is fraud, pure and simple.
Maybe Zeke Hausfather and his crony factcheckers might care to investigate! There again, pigs might fly.


