
https://elements.visualcapitalist.com/all-the-metals-we-mined-in-one-visualization/
All the Metals We Mined in One Visualization
Metals are all around us, from our phones and cars to our homes and office buildings.
While we often overlook the presence of these raw materials, they are an essential part of the modern economy. But obtaining these materials can be a complex process that involves mining, refining, and then converting them into usable forms.
So, how much metal gets mined in a year?
Metals vs Ores
Before digging into the numbers, it’s important that we distinguish between ores and metals.
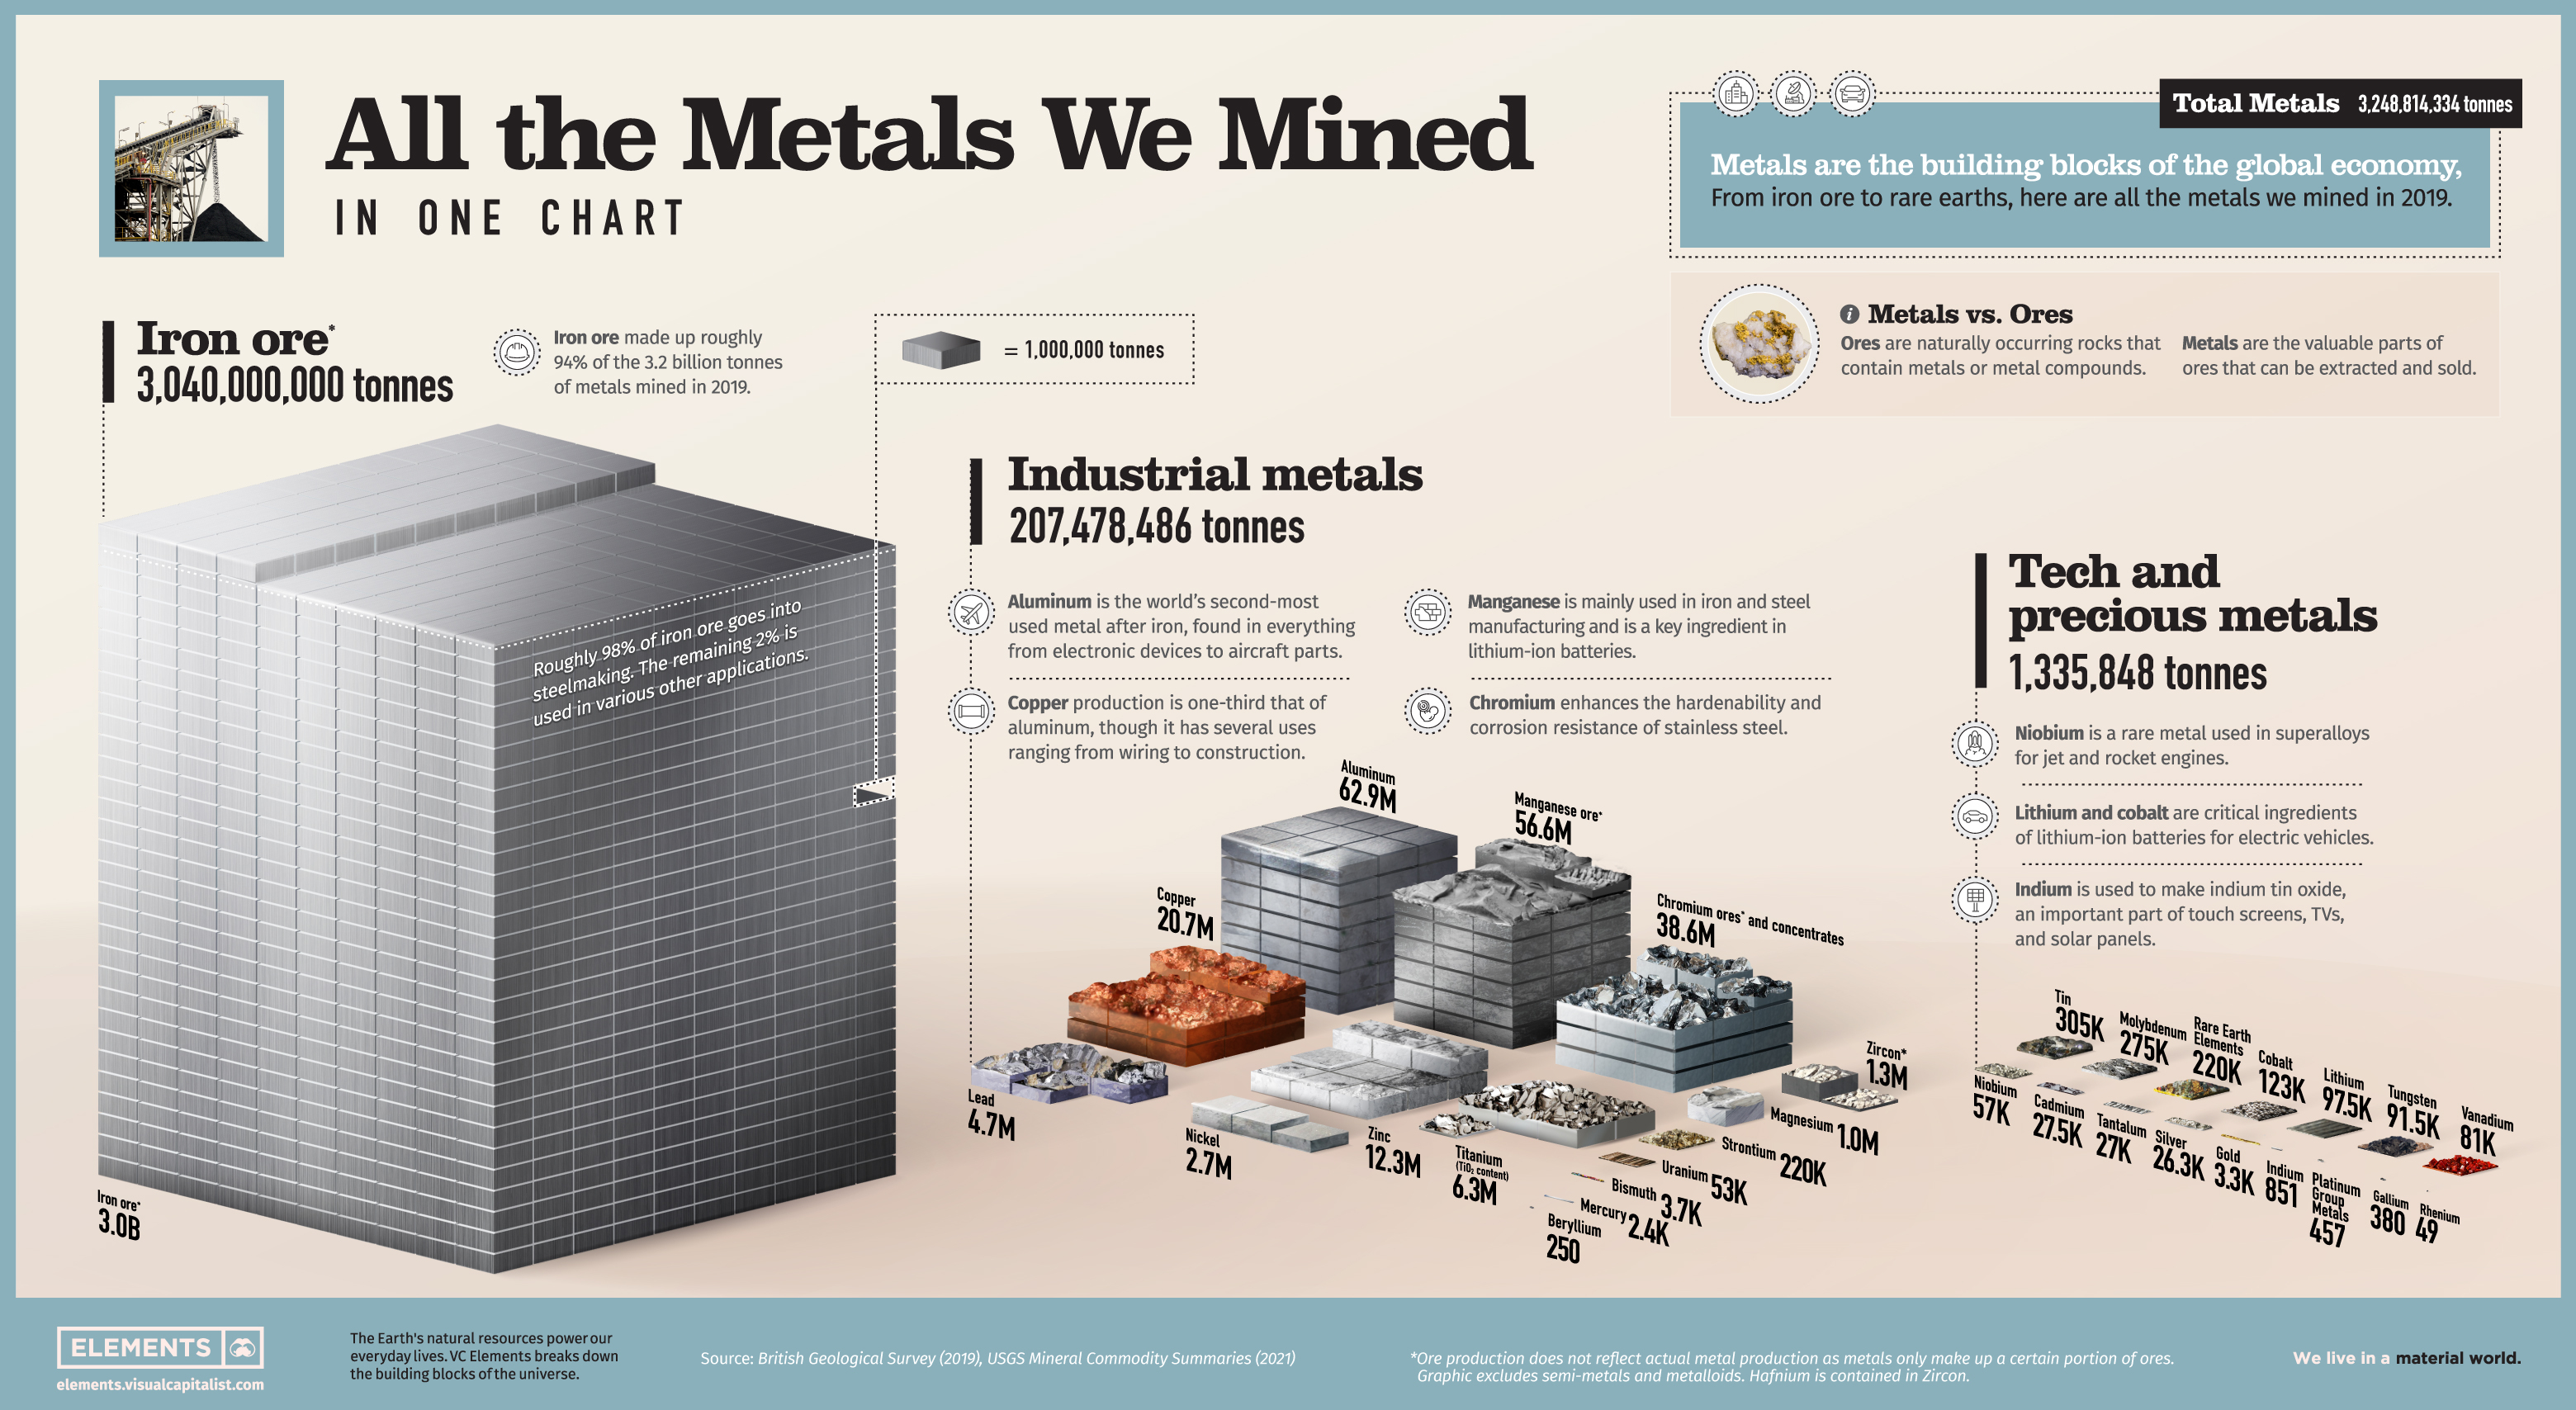
Ores are naturally occurring rocks that contain metals and metal compounds. Metals are the valuable parts of ores that can be extracted by separating and removing the waste rock. As a result, ore production is typically much higher than the actual metal content of the ore. For example, miners produced 347 million tonnes of bauxite ore in 2019, but the actual aluminum metal content extracted from that was only 62.9 million tonnes.
Here are all the metals and metal ores mined in 2019, according to the British Geological Survey:
| Metal/Ore | Quantity Mined (tonnes) | % of Total |
|---|---|---|
| Iron Ore | 3,040,000,000 | 93.57% |
| Industrial Metals | 207,478,486 | 6.39% |
| Technology and Precious Metals | 1,335,848 | 0.04% |
| Total | 3,248,814,334 | 100% |
Miners produced roughly three billion tonnes of iron ore in 2019, representing close to 94% of all mined metals. The primary use of all this iron is to make steel. In fact, 98% of iron ore goes into steelmaking, with the rest fulfilling various other applications.
Industrial and technology metals made up the other 6% of all mined metals in 2019. How do they break down?
Industrial Metals
From construction and agriculture to manufacturing and transportation, virtually every industry harnesses the properties of metals in different ways.
Here are the industrial metals we mined in 2019.
| Metal | Quantity Mined (tonnes) | % of Total |
|---|---|---|
| Aluminum | 62,900,000 | 30% |
| Manganese Ore | 56,600,000 | 27% |
| Chromium Ores and Concentrates | 38,600,000 | 19% |
| Copper | 20,700,000 | 10% |
| Zinc | 12,300,000 | 6% |
| Titanium (Titanium Dioxide Content) | 6,300,000 | 3% |
| Lead | 4,700,000 | 2% |
| Nickel | 2,702,000 | 1% |
| Zirconium Minerals (Zircon) | 1,337,000 | 1% |
| Magnesium | 1,059,736 | 1% |
| Total | 207,478,486 | 100% |
Percentages may not add up to 100 due to rounding.
It’s no surprise that aluminum is the most-produced industrial metal. The lightweight metal is one of the most commonly used materials in the world, with uses ranging from making foils and beer kegs to buildings and aircraft parts.
Manganese and chromium rank second and third respectively in terms of metal mined, and are important ingredients in steelmaking. Manganese helps convert iron ore into steel, and chromium hardens and toughens steel. Furthermore, manganese is a critical ingredient of lithium-manganese-cobalt-oxide (NMC) batteries for electric vehicles.
Although copper production is around one-third that of aluminum, copper has a key role in making modern life possible. The red metal is found in virtually every wire, motor, and electrical appliance in our homes and offices. It’s also critical for various renewable energy technologies and electric vehicles.
Technology and Precious Metals
Technology is only as good as the materials that make it.
Technology metals can be classified as relatively rare metals commonly used in technology and devices. While miners produce some tech and precious metals in large quantities, others are relatively scarce.
| Metal | Quantity Mined in 2019 (tonnes) | % of Total |
|---|---|---|
| Tin | 305,000 | 23% |
| Molybdenum | 275,000 | 21% |
| Rare Earth Elements | 220,000 | 16% |
| Cobalt | 123,000 | 9% |
| Lithium | 97,500 | 7% |
| Tungsten | 91,500 | 7% |
| Vanadium | 81,000 | 6% |
| Niobium | 57,000 | 4% |
| Cadmium | 27,500 | 2% |
| Tantalum | 27,000 | 2% |
| Total | 1,335,848 | 100.00% |
Percentages may not add up to 100 due to rounding.
Tin was the most-mined tech metal in 2019, and according to the International Tin Association, nearly half of it went into soldering.
It’s also interesting to see the prevalence of battery and energy metals. Lithium, cobalt, vanadium, and molybdenum are all critical for various energy technologies, including lithium-ion batteries, wind farms, and energy storage technologies. Additionally, miners also extracted 220,000 tonnes of rare earth elements, of which 60% came from China.
Given their rarity, it’s not surprising that gold, silver, and platinum group metals (PGMs) were the least-mined materials in this category. Collectively, these metals represent just 2.3% of the tech and precious metals mined in 2019.
A Material World
Although humans mine and use massive quantities of metals every year, it’s important to put these figures into perspective.
According to Circle Economy, the world consumes 100.6 billion tonnes of materials annually. Of this total, 3.2 billion tonnes of metals produced in 2019 would account for just 3% of our overall material consumption. In fact, the world’s annual production of cement alone is around 4.1 billion tonnes, dwarfing total metal production.
The world’s appetite for materials is growing with its population. As resource-intensive megatrends such as urbanization and electrification pick up the pace, our material pie will only get larger.

YOU MAY LIKE
-
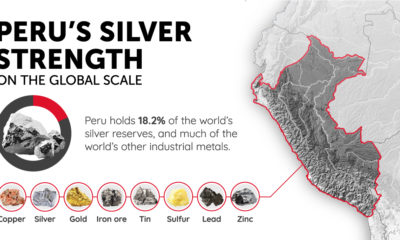
Visualizing Peru’s Silver Mining Strength
-
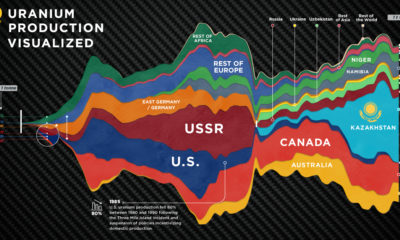
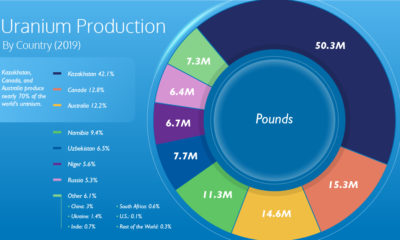
70 Years of Global Uranium Production by Country
-
The Future of Uranium: A Story of Supply and Demand
-

The Next Frontier: Mineral Exploration in Saskatchewan
-
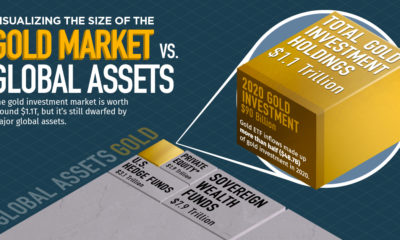
Visualizing Gold Investment Compared to Global Assets
-
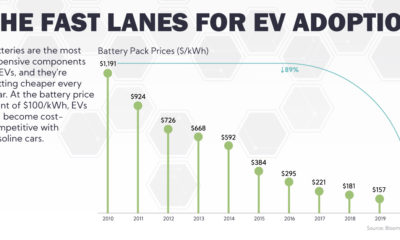
The Road to EV Adoption: Fast Lanes and Potholes
ENERGY SHIFT
Visualizing the Products and Fuels Made from Crude Oil
Oil is a building block that makes modern life possible. This graphic looks at the proportion of finished products that are created from crude oil.
Published
1 month agoon
September 7, 2021
What Products Are Made from a Barrel of Crude Oil?
From the gasoline in our cars to the plastic in countless everyday items, crude oil is an essential raw material that shows up everywhere in our lives.
With around 18 million barrels of crude oil consumed every day just in America, this commodity powers transport, utilities, and is a vital ingredient in many of the things we use on a daily basis.
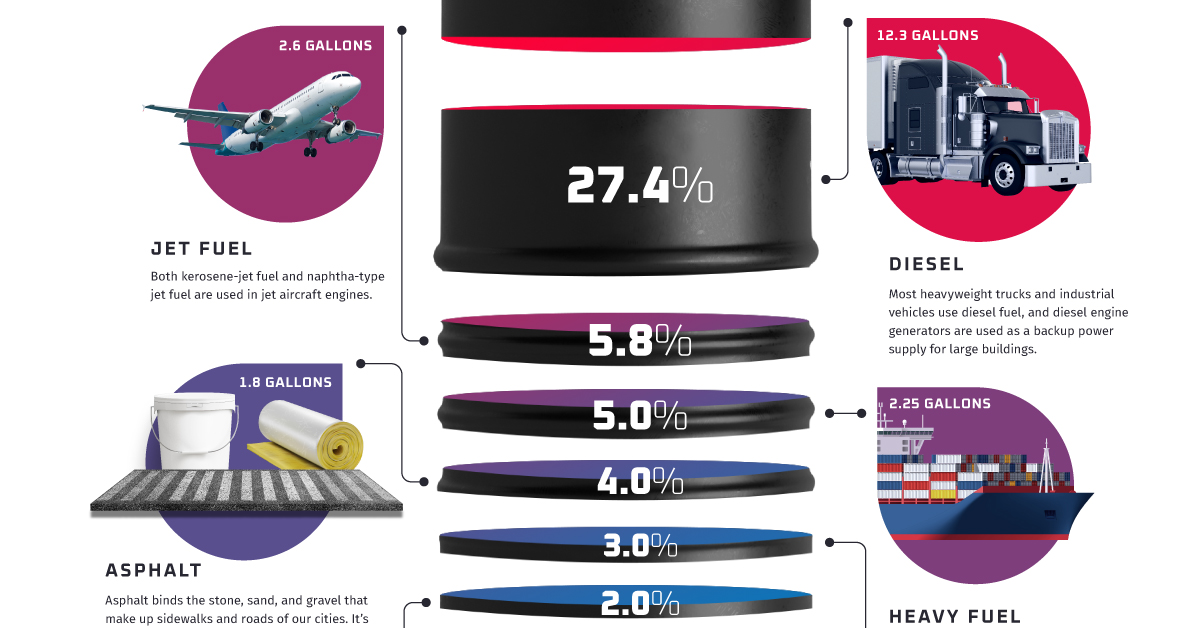
This graphic visualizes how much crude oil is refined into various finished products, using a barrel of oil to represent the proportional breakdown.
From Crude Oil to Functional Fuel and More
Crude oil is primarily refined into various types of fuels to power transport and vital utilities. More than 85% of crude oil is refined into fuels like gasoline, diesel, and hydrocarbon gas liquids (HGLs) like propane and butane.
Along with being fuels for transportation, heating, and cooking, HGLs are used as feedstock for the production of chemicals, plastics, and synthetic rubber, and as additives for motor gasoline production.
| Refined Crude Oil Product | Share of Crude Oil Refined |
|---|---|
| Gasoline | 42.7% |
| Diesel | 27.4% |
| Jet fuel | 5.8% |
| Heavy fuel | 5.0% |
| Asphalt | 4.0% |
| Light fuel | 3.0% |
| Hydrocarbon gas liquids | 2.0% |
| Other | 10.1% |
Source: Canadian Association of Petroleum Producers
Crude oil not only powers our vehicles, but it also helps pave the roads we drive on. About 4% of refined crude oil becomes asphalt, which is used to make concrete and different kinds of sealing and insulation products.
Although transportation and utility fuels dominate a large proportion of refined products, essential everyday materials like wax and plastic are also dependent on crude oil. With about 10% of refined products used to make plastics, cosmetics, and textiles, a barrel of crude oil can produce a variety of unexpected everyday products.
Personal care products like cosmetics and shampoo are made using petroleum products, as are medical supplies like IV bags and pharmaceuticals. Modern life would look very different without crude oil.
The Process of Refining Crude Oil
You might have noticed that while a barrel of crude oil contains 42 gallons, it ends up producing 45 gallons of refined products. This is because the majority of refined products have a lower density than crude oil, resulting in an increase in volume that is called processing gain.
Along with this, there are other inputs aside from crude oil that are used in the refining process. While crude oil is the primary input, fuel ethanol, hydrocarbon gas liquids, and other blending liquids are also used.
| U.S. Refiner and Blender Inputs | Share of Total |
|---|---|
| Crude oil | 85.4% |
| Fuel ethanol | 4.8% |
| Blending components | 3.5% |
| Hydrocarbon gas liquids | 3.0% |
| Other liquids | 3.3% |
Source: EIA
The process of refining a 30,000-barrel batch of crude oil typically takes between 12-24 hours, with refineries operating 24 hours a day, 365 days a year. Although the proportions of individual refined products can vary depending on market demand and other factors, the majority of crude oil will continue to become fuel for the world’s transport and utilities.
The Difficulty of Cutting Down on Crude Oil
From the burning of heavy fuels tarnishing icebergs found in Arctic waters to the mounds of plastic made with petrochemicals that end up in our rivers, crude oil and its refined products impact our environment in many different ways.
But even as the world works to reduce its consumption of fossil fuels in order to reach climate goals, a world without crude oil seems unfathomable.
Skyrocketing sales of EVs still haven’t managed to curb petroleum consumption in places like Norway, California, and China, and the steady reopening of travel and the economy will only result in increased petroleum consumption.
Completely replacing the multi-faceted “black gold” that is crude oil isn’t possible right now, but as electrification continues and we find alternatives to petrochemical materials, humanity might at least manage to reduce its dependence on burning fossil fuels.
ELECTRIFICATION
The Biggest Mining Companies in the World in 2021
The graphic takes a look at the world’s largest mining companies by market capitalization and the metals they produce.
Published
2 months agoon
August 4, 2021
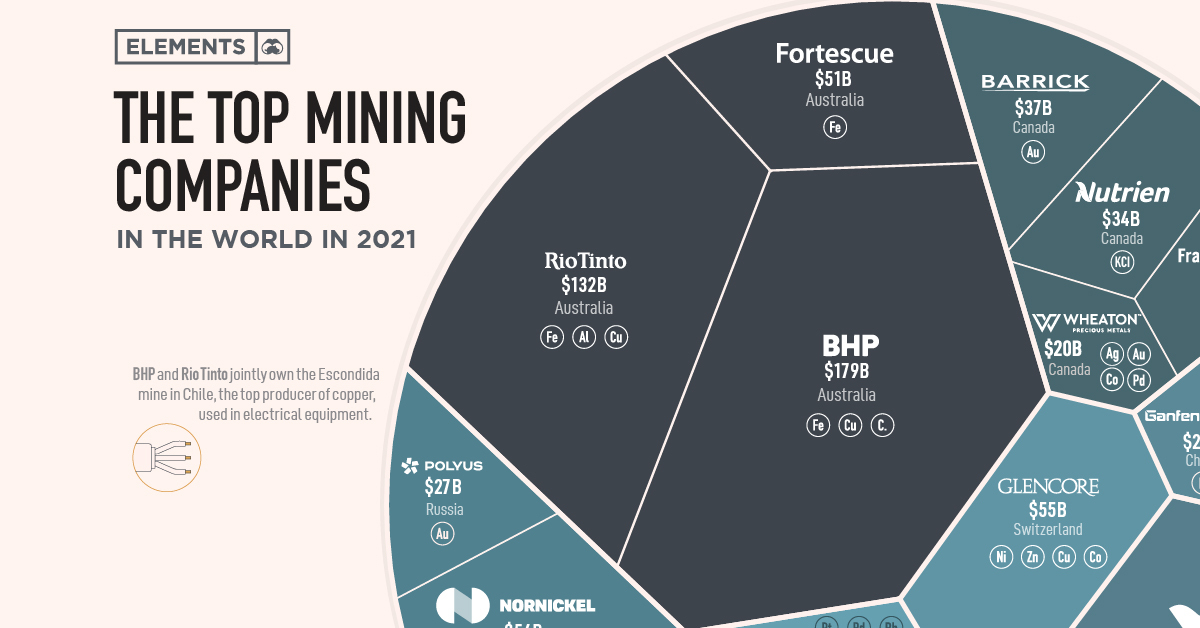
Ranked: The Top 20 Mining Companies
Mining companies have emerged from the COVID-19 pandemic in excellent financial and operational shape and the forecast is even brighter as the economy recovers.
The market is expected to reach a value of nearly $1.86 trillion by 2022, with the increasing demand for minerals for power generation and renewables technology.
In the graphic above, we show the world’s top companies by market capitalization as of June 22, 2021, and the metals they mine.

