https://notalotofpeopleknowthat.wordpress.com/2021/08/14/hottest-month-poppycock/
By Paul Homewood
More, disgraceful reporting by the BBC (complete with a disgusting use of a photo of the Turkish wildfires):
July was the world’s hottest month ever recorded, a US federal scientific and regulatory agency has reported.
The data shows that the combined land and ocean-surface temperature was 0.93C (1.68F) above the 20th Century average of 15.8C (60.4F).
It is the highest temperature since record-keeping began 142 years ago. The previous record, set in July 2016, was equalled in 2019 and 2020.
Experts believe this is due to the long-term impact of climate change.
In a statement, the National Oceanic and Atmospheric Administration (NOAA) said that July’s “unenviable distinction” was a cause for concern.
“In this case, first place is the worst place to be,” NOAA administrator Rick Spinrad said in a statement.
“This new record adds to the disturbing and disruptive path that climate change has set for the globe.”
The combined land and ocean-surface temperature was 0.01C higher than the 2016 record.
In the Northern Hemisphere, land-surface temperature reached an “unprecedented” 1.54C higher than average, surpassing a previous record set in 2012.

https://www.bbc.co.uk/news/world-us-canada-58208792
#
Paul Homewood comments:
Meanwhile, back in the real world, July temperature anomalies even according to NOAA themselves are well below the peaks of 2015 and 2016, and barely higher than they were two decades ago:
https://www.ncdc.noaa.gov/cag/global/time-series/globe/land_ocean/all/7/1980-2021
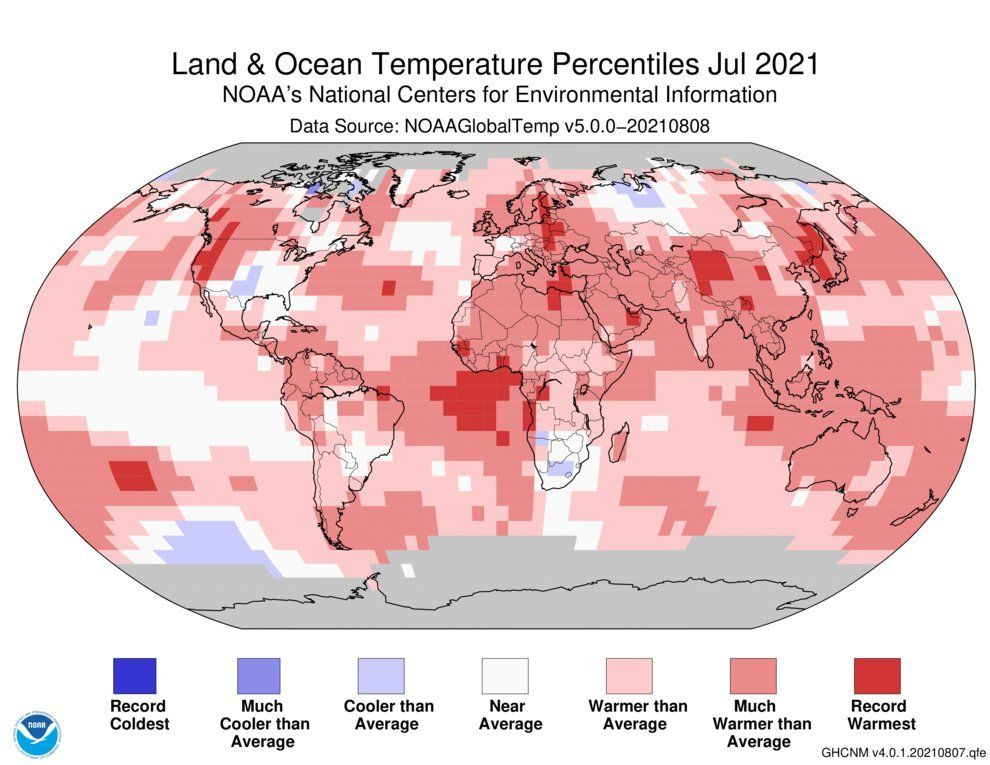
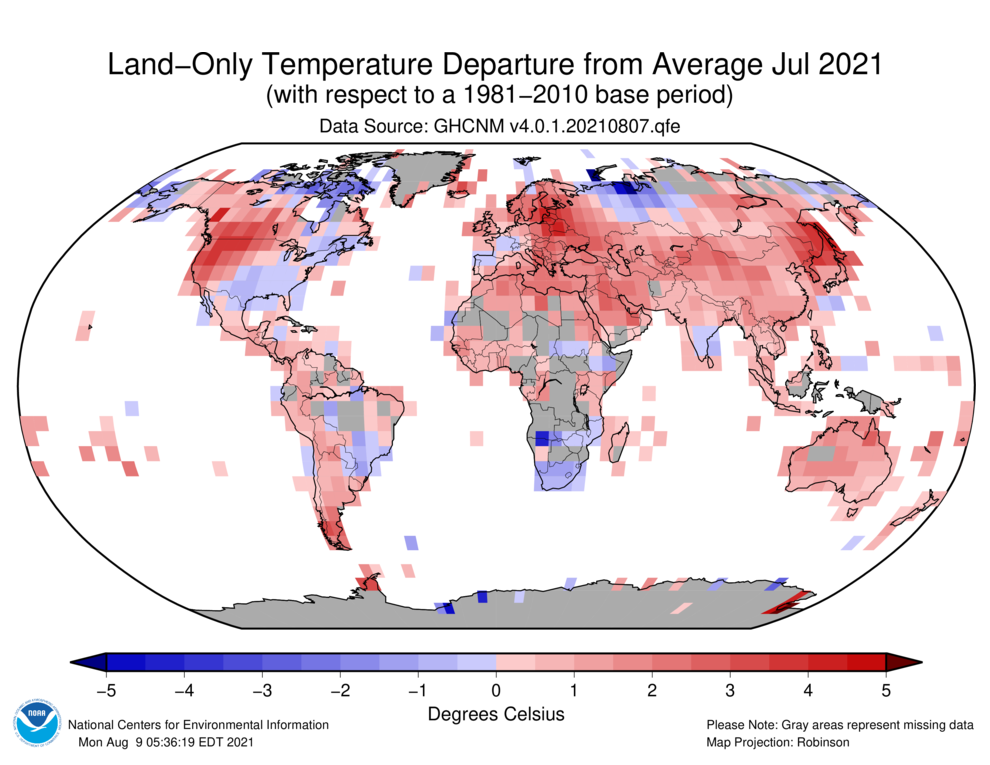
And the claim that they know the world’s temperature to one hundredth of a degree is ridiculous. Far from the full global coverage implied by the BBC’s map above, below is the actual coverage:

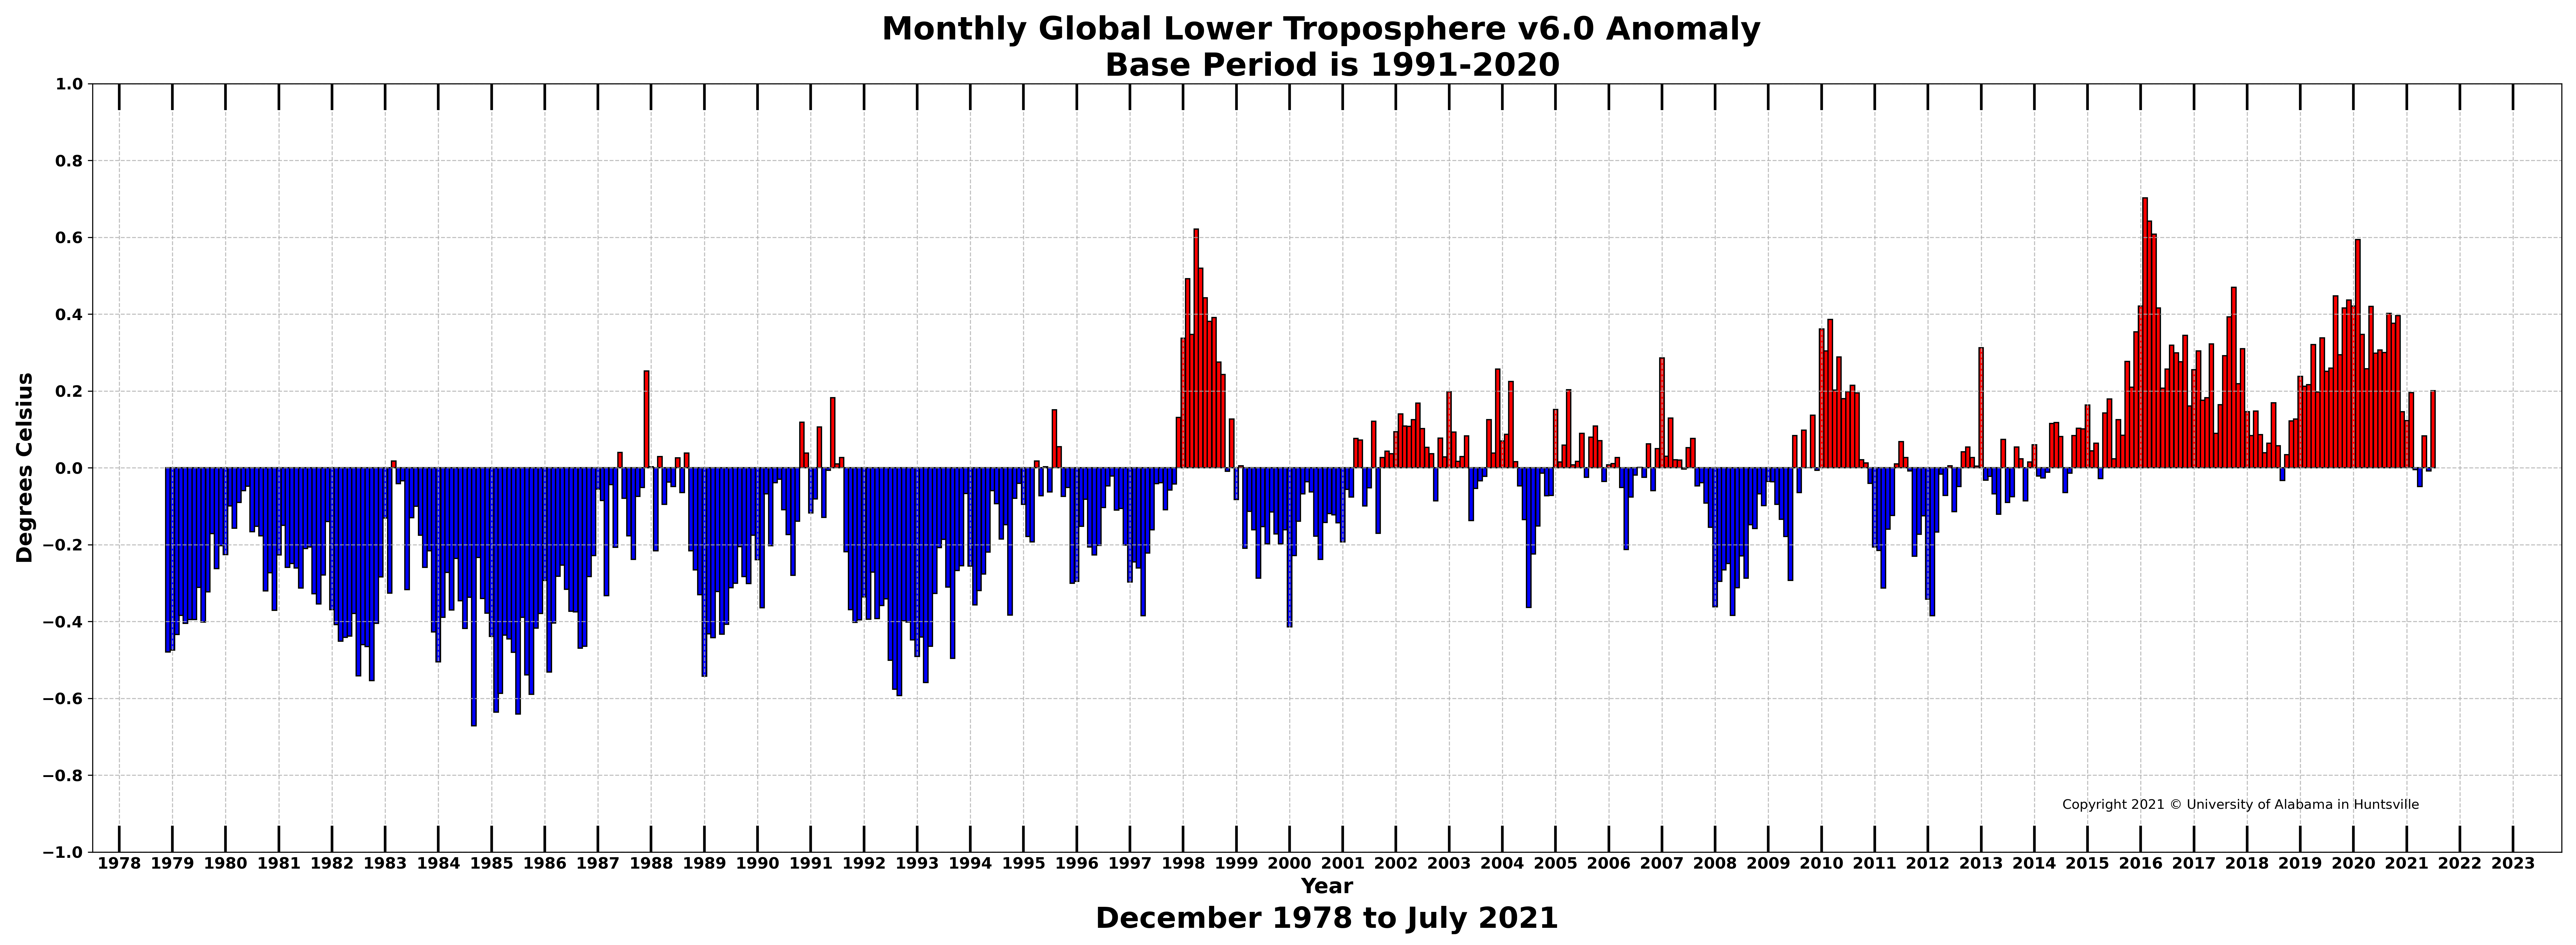
Large parts of the world have no coverage at all, and much of the rest is affected by UHI. In contrast, satellites offer virtually 100% coverage, other around the poles, and are not corrupted by UHI. Data from these satellites indicate that atmospheric temperatures are no higher now than in 2002:


