
By Paul Homewood
h/t Dennis Ambler
We’ve known for a long while, but this proves the EPA is not an objective, scientific organisation, but a purely political one:

The Environmental Protection Agency has revived its dashboard of key climate change indicators after four years with no updates.
From spikes in summer heat waves to sea level rise to the loss of melting ice sheets, the EPA says the data shows “compelling and clear evidence of changes to our climate.”
EPA Administrator Michael Regan stressed the danger to the entire country.
“Americans are seeing and feeling the impacts up close with increasing regularity,” Regan told reporters Wednesday, according to the Washington Post.
Here are some of the key impacts singled out by the EPA:
-Major U.S. cities average six heat waves a year, three times more than in the ’60s.
-Global concentrations of carbon dioxide, methane and nitrous oxide are unprecedented.
-Sea levels rose more than 8 inches along parts of the mid-Atlantic and Gulf coasts between 1960 and 2020.
-Arctic sea ice extent in September 2020 was more than 900,000 square miles less than the historical 1981–2010 average for that month — a difference three and half times the size of Texas.
-Ocean heat reached its highest level in recorded history last year.
https://weather.com/news/climate/news/2021-05-13-epa-climate-change-indicators-website-data
#
Paul Homewood comments:
Let’s examine these claims:
1) Heat Waves
To use data from large cities is simply fraudulent, as these are heavily affected by UHI. Similarly, the choice of the 1960s as the base point is equally fraudulent.
Here’s the latest chart from the EPA:

https://www.epa.gov/climate-indicators/climate-change-indicators-heat-waves
But this is their Fig 3 on the same page:

The 1960s and 70s were a much colder interlude, so it is not surprising heat waves have increased since then. They are however much less intense nowthan during the 1930s, and no worse than the rest of the pre 1960 period.
2) Concentrations of Carbon Dioxide
Quite why this is an “impact of global warming” beats me. And Americans most certainly are not “seeing and feeling it”.
3) Sea Level Rise of up to 8 inches since 1960
Sea levels have been rising steadily since the end of the Little Ice Age in the late 19thC.
Over the last fifty years, sea levels on the East Coast have been rising at a rate of around 3 to 4mm /yr, a total of about 7 inches. However, the rate of rise was just as great in the first half of the 20thC:
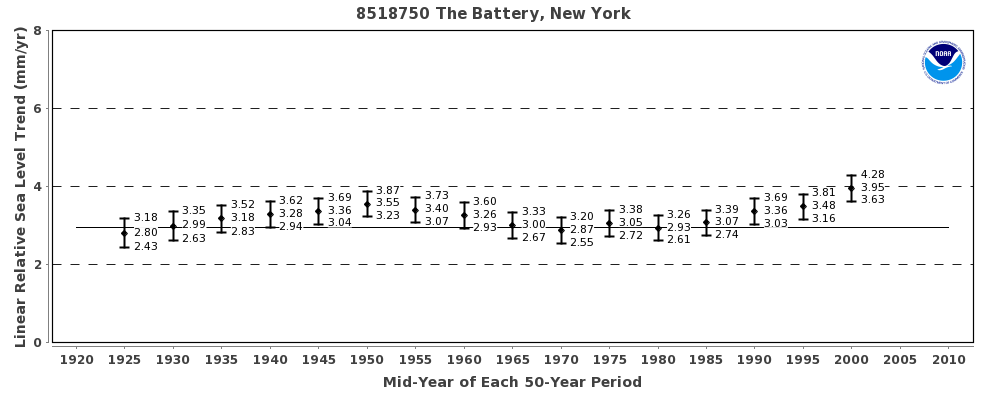
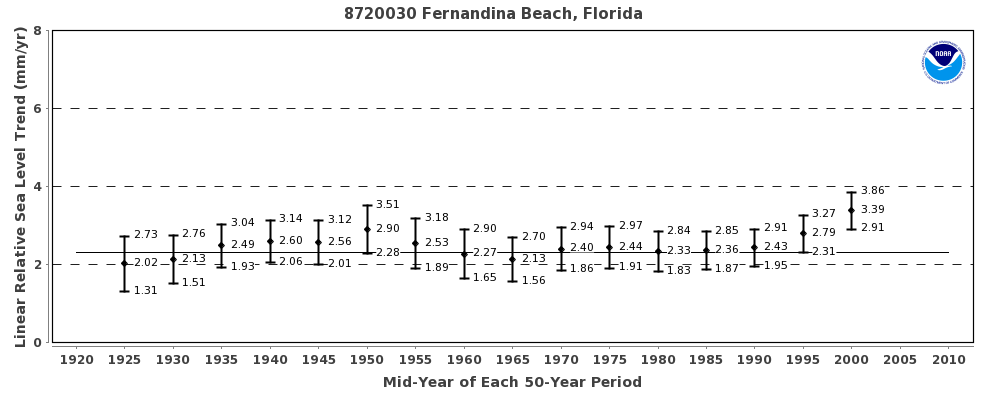
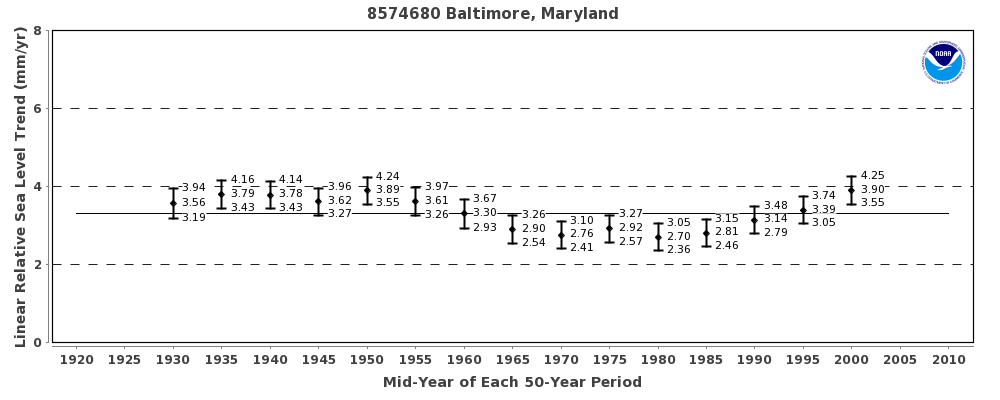
Part of this sea level rise is caused by sinking landmasses, known as isostasy, the result of the melting of the Ice Age glaciers. This typically accounts for between 1mm and 3mm a year.

https://www.thegwpf.org/official-us-climate-data-reveals-no-cause-for-alarm/
4) Arctic Sea Ice Extent
Now they’re getting desperate!
Sea ice extent has actually been stable since 2007, and there is no evidence whatsoever that it has any impact at all on America, one way or another.
5) Ocean Heat
Again, more desperation!
The claimed changes in ocean heat content are so tiny that they simply cannot be accurately measured, even with modern technology.
In any event, the small increase in heat content is consistent with the gradual warming of the climate since the Little Ice Age.
Bogeyman
The simple reality is that the EPA have been totally unable to find any detrimental effects of global warming in the United States, and have therefore had to resort to this assortment of cherry picking and irrelevant bogeymen..
Indeed, as the EPA’s own graphs below prove, there have been no trends in hurricane activity, droughts were much worse in the past, there has been little change in river flooding and extremely cold weather is now a rarity. In other words, the sort of things people do worry about.
It is, of course, significant, that the EPA have rushed to bring out this piece of political disinformation so soon after the election, after it had not been updated during Trump’s term.


