https://notalotofpeopleknowthat.wordpress.com/2021/05/06/washingtons-new-climate-normals-are-hotter/
By Paul Homewood
Today’s fraud from the Washington Post:
New climate normals, describing the average weather over the past 30 years, were released by the National Oceanic and Atmospheric Administration on Tuesday. Around the country, the increase seen in temperatures and precipitation compared with earlier 30-year periods is palpable. Around D.C., it’s a similar tale.
NOAA unveils new U.S. climate ‘normals’ that are warmer than ever
Washington’s rising temperatures mean the city now has a streak in the summer when 90 degrees is the new “normal” high. On the other end of the scale, “normal” lows in the 20s are all but gone, with the city now bottoming out at a rounded average of 30 degrees.
Precipitation is up. Especially in summer. Despite that, snow is declining, a downer for fans of winter.
Temperatures are up across the board
All months of the year now have a higher temperature average than they used to in Washington. Let’s compare the new normals, based on the period 1991-2020, with the old normals, based on the period 1981-2010.
December has seen the biggest gain, warming 2.0 degrees. Oddly enough, November is the smallest, with a bump of just 0.3 degrees.
Monthly temperatures in the current and last two normal periods. (Ian Livingston/The Washington Post)
Annually, Washington’s average temperature is up from 58.2 to 59.3, a gain of 1.1 degrees. In general, average low temperatures are rising faster than highs. Annual lows are up 1.4 degrees and average highs are up 1.1 degrees.
The increase in temperature over the past two 30-year periods continues a long-term upward trend. During the last update in 30-year normals a decade ago, every month gained warmth as well. The gains were even larger with the current update.
More hot days and fewer freezes
Perhaps the most significant change in the new normals is that our hottest summer days now have an average high of 90 degrees.
There’s now a 22-day streak from July 6 to July 27 where the typical high is indeed 90.
The increase in temperature over the past two 30-year periods continues a long-term upward trend. During the last update in 30-year normals a decade ago, every month gained warmth as well. The gains were even larger with the current update.
This is a breathtaking increase, given that in the old normals our summer peak temperature was 89 degrees for 16 days in a row. The new normals have a remarkable 45 days at or above 89 degrees, running from June 28 to Aug. 11.
Washington winters are rapidly warming up and feeling more Southern
But perhaps this change shouldn’t come as a surprise. Recall that last summer we hit 90 degrees on 20 straight days, the second-longest such streak on record. And, in July, we posted 28 90-degree days, the most in any month on record.
https://www.washingtonpost.com/weather/2021/05/05/washington-dc-new-climate-normals/
#
Paul Homewood comments:
The nearest, long-running rural weather station is at Purcellville, 75 miles from Washington DC. Data back to 1900 from KNMI show that recent daily temperature highs are not any greater than the past, and lower than in many other periods:
CLIMOD shows exactly the same thing. Both KNMI and CLIMOD, of course, use official NOAA data:
http://climod2.nrcc.cornell.edu/
The article also claims that days of 90F and over are becoming more frequent, but again this is not supported by the data. What is clear, however, is that they became less frequent during the 1970s and 80s, which is the period against today’s climate is being compared. The article talks about “28 90-degree days” last July; but over the summer as a whole, the 40 such days recorded at Winchester, were not in the least unusual:
The contrast with winter days is even more stark. The article claims:
Cold is less cold, as well. Before the new normals were published, the city had 37 days with lows at or below 29 degrees from Dec. 31 to Feb. 5.
Now? We have zero such days.
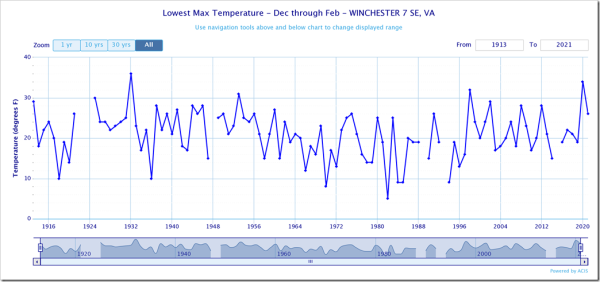
But the data for Winchester shows winter lows are similar to the period 1920 to 1960. There is, however, a clearly much colder interlude in the 1970s and 80s.
Washington itself is, of course, heavily affected by the urban heat island effect. Competent meteorologists, unlike the Capital Weather Gang, would not confuse this with climate.
Finally, let’s look at rainfall. What we find is that annual rainfall is much more consistent than at times in the past, when severe droughts were common. Again, we can note that the 1970s and 80s, had many years with significantly below average rainfall. Most people would regard this as a good thing.
Climate at a Glance | National Centers for Environmental Information (NCEI) (noaa.gov)


