
We are all living with the consequences of climate modelers stubbornly using generation after generation of models that exhibit too much surface and tropospheric warming, in addition to running grossly exaggerated forcing scenarios https://t.co/ISmusJMDG0
— Bjorn Lomborg (@BjornLomborg) August 26, 2020
by Ross McKitrick
Two new peer-reviewed papers from independent teams confirm that climate models overstate atmospheric warming and the problem has gotten worse over time, not better.
The papers are Mitchell et al. (2020) “The vertical profile of recent tropical temperature trends: Persistent model biases in the context of internal variability” Environmental Research Letters, and McKitrick and Christy (2020) “Pervasive warming bias in CMIP6 tropospheric layers” Earth and Space Science. John and I didn’t know about the Mitchell team’s work until after their paper came out, and they likewise didn’t know about ours.
Mitchell et al. look at the surface, troposphere and stratosphere over the tropics (20N to 20S). John and I look at the tropical and global lower- and mid- troposphere. Both papers test large samples of the latest generation (“Coupled Model Intercomparison Project version 6” or CMIP6) climate models, i.e. the ones being used for the next IPCC report, and compare model outputs to post-1979 observations. John and I were able to examine 38 models while Mitchell et al. looked at 48 models. The sheer number makes one wonder why so many are needed, if the science is settled. Both papers looked at “hindcasts,” which are reconstructions of recent historical temperatures in response to observed greenhouse gas emissions and other changes (e.g. aerosols and solar forcing). Across the two papers it emerges that the models overshoot historical warming from the near-surface through the upper troposphere, in the tropics and globally.
Mitchell et al. 2020
Mitchell et al. had, in an earlier study, examined whether the problem is that the models amplify surface warming too much as you go up in altitude, or whether they get the vertical amplification right but start with too much surface warming. The short answer is both.

In this Figure the box/whiskers are model-predicted warming trends in the tropics (20S to 20N) (horizontal axis) versus altitude (vertical axis). Where the trend magnitudes cross the zero line is about where the stratosphere begins. Red= models that internally simulate both ocean and atmosphere. Blue: models that take observed sea surface warming as given and only simulate the air temperature trends. Black lines: observed trends. The blue boxes are still high compared to the observations, especially in the 100-200hPa level (upper-mid troposphere).
Overall their findings are:
- “we find considerable warming biases in the CMIP6 modeled trends, and we show that these biases are linked to biases in surface temperature (these models simulate an unrealistically large global warming).”
- “we note here for the record that from 1998 to 2014, the CMIP5 models warm, on average 4 to 5 times faster than the observations, and in one model the warming is 10 times larger than the observations.”
- “Throughout the depth of the troposphere, not a single model realization overlaps all the observational estimates. However, there is some overlap between the RICH observations and the lowermost modelled trend, which corresponds to the NorCPM1 model.”
- “Focusing on the CMIP6 models, we have confirmed the original findings of Mitchell et al. (2013): first, the modeled tropospheric trends are biased warm throughout the troposphere (and notably in the upper troposphere, around 200 hPa) and, second, that these biases can be linked to biases in surface warming. As such, we see no improvement between the CMIP5 and the CMIP6 models.” (Mitchell et al. 2020)
A special prize goes to the Canadian model! “We draw attention to the CanESM5 model: it simulates the greatest warming in the troposphere, roughly 7 times larger than the observed trends.” The Canadian government relies on the CanESM models “to provide science-based quantitative information to inform climate change adaptation and mitigation in Canada and internationally.” I would be very surprised if the modelers at UVic ever put warning labels on their briefings to policy makers. The sticker should read: “WARNING! This model predicts atmospheric warming roughly 7 times larger than observed trends. Use of this model for anything other than entertainment purposes is not recommended.”
Although the above diagram looks encouraging in the stratosphere, Mitchell et al. found the models get it wrong too. They predict too little cooling before 1998 and too much after, and the effects cancel in a linear trend. The vertical “fingerprint” of GHG in models is warming in the troposphere and cooling in the stratosphere. Models predict steady stratospheric cooling should have continued after late 1990s but observations show no such cooling this century. The authors suggest the problem is models are not handling ozone depletion effects correctly.
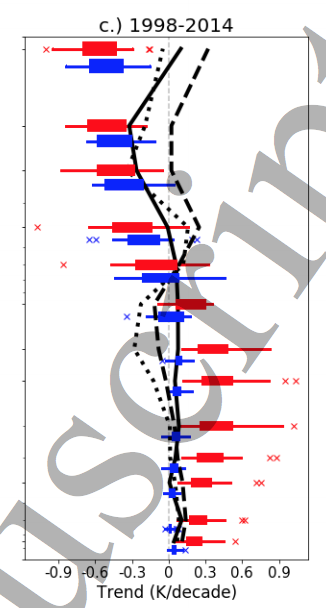
The above diagram focuses on the 1998-2014 span. Compare the red box/whiskers to the black lines. The red lines are climate model outputs after feeding in observed GHG and other forcings over this interval. The predicted trends don’t match the observed trend profile (black line) – there’s basically no overlap at all. They warm too much in the troposphere and cool too much in the stratosphere. Forcing models to use prescribed sea surface temperatures (blue), which in effect hands the “right” answer to the model for most of the surface area, mitigates the problem in the troposphere but not the stratosphere.
McKitrick and Christy 2020
John Christy and I had earlier compared models to observations in the tropical mid-troposphere, finding evidence of a warming bias in all models. This is one of several papers I’ve done on tropical tropospheric warm biases. The IPCC cites my work (and others’) and accepts the findings. Our new paper shows that, rather than the problem being diminished in the newest models, it is getting worse. The bias is observable in the lower- and mid-troposphere in the tropics but also globally.
We examined the first 38 models in the CMIP6 ensemble. Like Mitchell et al. we used the first archived run from each model. Here are the 1979-2014 warming trend coefficients (vertical axis, degrees per decade) and 95% error bars comparing models (red) to observations (blue). LT=lower troposphere, MT=mid-troposphere. Every model overshoots the observed trend (horizontal dashed blue line) in every sample.

Most of the differences are significant at <5%, and the model mean (thick red) versus observed mean difference is very significant, meaning it’s not just noise or randomness. The models as a group warm too much throughout the global atmosphere, even over an interval where modelers can observe both forcings and temperatures.
We used 1979-2014 (as did Mitchell et al. ) because that’s the maximum interval for which all models were run with historically-observed forcings and all observation systems are available. Our results would be the same if we use 1979-2018, which includes scenario forcings in final years. (Mitchell et al. report the same thing.)
John and I found that models with higher Equilibrium Climate Sensitivity (>3.4K) warm faster (not surprisingly), but even the low-ECS group (<3.4K) exhibits warming bias. In the low group the mean ECS is 2.7K, the combined LT/MT model warming trend average is 0.21K/decade and the observed counterpart is 0.15K/decade. This figure (green circle added; see below) shows a more detailed comparison.

The horizontal axis shows the model warming trend and the vertical axis shows the corresponding model ECS. The red squares are in the high ECS group and the blue circles are in the low ECS group. Filled shapes are from the LT layer and open shapes are from the MT layer. The crosses indicate the means of the four groups and the lines connect LT (solid) and MT (dashed) layers. The arrows point to the mean observed MT (open arrow, 0.09C/decade) and LT (closed arrow, 0.15 C/decade) trends.
While the models in the blue cluster (low ECS) do a better job, they still have warming rates in excess of observations. If we were to picture a third cluster of models with mean global tropospheric warming rates overlapping observations it would have to be positioned roughly in the area I’ve outlined in green. The associated ECS would be between 1.0 and 2.0K.
Concluding remarks
I get it that modeling the climate is incredibly difficult, and no one faults the scientific community for finding it a tough problem to solve. But we are all living with the consequences of climate modelers stubbornly using generation after generation of models that exhibit too much surface and tropospheric warming, in addition to running grossly exaggerated forcing scenarios (e.g. RCP8.5). Back in 2005 in the first report of the then-new US Climate Change Science Program, Karl et al. pointed to the exaggerated warming in the tropical troposphere as a “potentially serious inconsistency.” But rather than fixing it since then, modelers have made it worse. Mitchell et al. note that in addition to the wrong warming trends themselves, the biases have broader implications because “atmospheric circulation trends depend on latitudinal temperature gradients.” In other words when the models get the tropical troposphere wrong, it drives potential errors in many other features of the model atmosphere. Even if the original problem was confined to excess warming in the tropical mid-troposphere, it has now expanded into a more pervasive warm bias throughout the global troposphere.
If the discrepancies in the troposphere were evenly split across models between excess warming and cooling we could chalk it up to noise and uncertainty. But that is not the case: it’s all excess warming. CMIP5 models warmed too much over the sea surface and too much in the tropical troposphere. Now the CMIP6 models warm too much throughout the global lower- and mid-troposphere. That’s bias, not uncertainty, and until the modeling community finds a way to fix it, the economics and policy making communities are justified in assuming future warming projections are overstated, potentially by a great deal depending on the model.
References:
Karl, T. R., S. J. Hassol, C. D. Miller, and W. L. Murray (2006). Temperature Trends in the Lower Atmosphere: Steps for Understanding and Reconciling Differences. Synthesis and Assessment Product. Climate Change Science Program and the Subcommittee on Global Change Research
McKitrick and Christy (2020) “Pervasive warming bias in CMIP6 tropospheric layers” Earth and Space Science.
Mitchell et al. (2020) “The vertical profile of recent tropical temperature trends: Persistent model biases in the context of internal variability” Environmental Research Letters.
Climate Model Weaknesses
— 𝔻𝕒𝕨𝕟𝕋𝕁𝟡𝟘™ 🇵🇭💖🇨🇦 Climate of Dawn (@DawnTJ90) January 29, 2021

