
https://www.thegwpf.org/the-reassuring-facts-about-the-climate-in-2019/
London, 26 May: 2019 saw the continuation of many climate trends, most of them unalarming and even reassuring. That’s the conclusion of a new report published by the Global Warming Policy Foundation.
According to the author, Professor Ole Humlum, although there has been a gentle warming in the last 40 years, storm activity is unchanged and snow cover remains stable. And while sea ice has declined, much of this may be natural variation.
“This report focuses on empirical observations and not on climate modelling speculations, says Professor Humlum. “We should therefore be greatly reassured by what these data are telling us”.
Professor Humlum also points out that new data on rising ocean temperatures raise interesting questions about the source of the heat.
“We can detect a great deal of heat rising from the bottom of the oceans. This obviously cannot be anything to do with human activity. So although people say the oceans are warming, in reality there is still much to learn.”
And Professor Humlum points out that where there is ignorance, it is always wise to be cautious.
“We have learned in recent months about the potentially high cost of leaping to conclusions. We must take more care in our response to small changes in the climate.”
The full report can be downloaded here
The State of the Climate 2019 (pdf)
About the author
Ole Humlum is former Professor of Physical Geography at the University Centre in Svalbard, Norway, and Emeritus Professor of Physical Geography, University of Oslo, Norway.
#
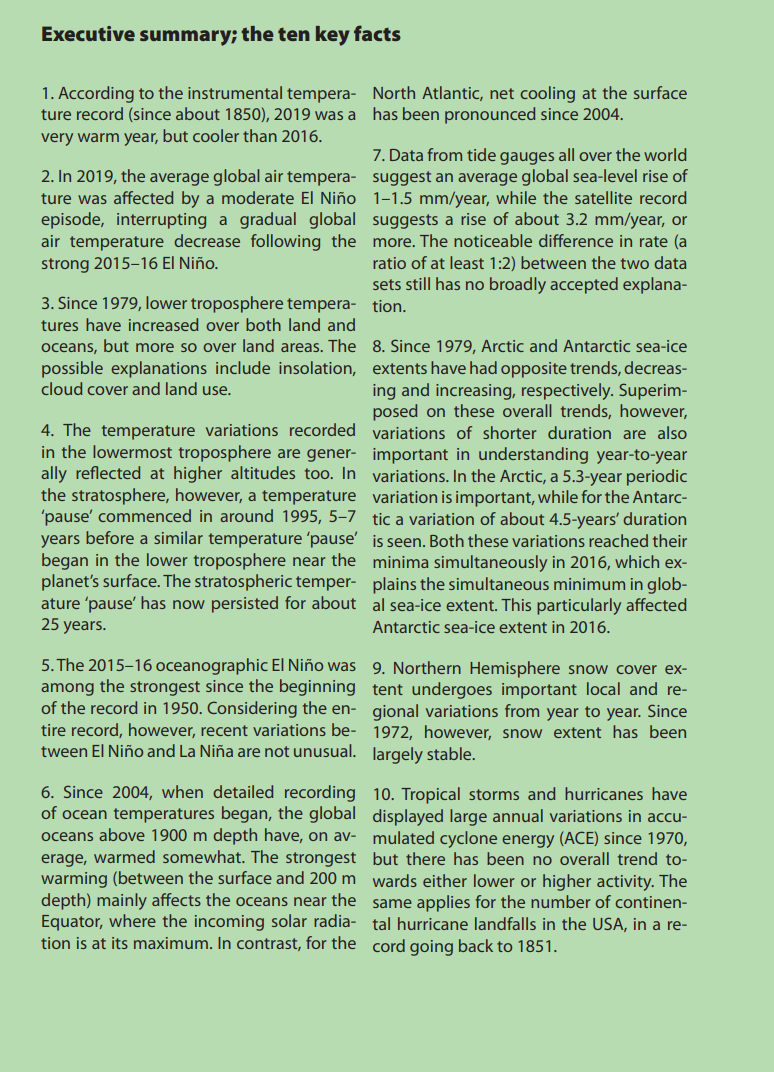
Executive summary; the ten key facts
1. According to the instrumental temperature record (since about 1850), 2019 was a very warm year, but cooler than 2016.
2. In 2019, the average global air temperature was affected by a moderate El Niño episode, interrupting a gradual global air temperature decrease following the strong 2015–16 El Niño.
3. Since 1979, lower troposphere temperatures have increased over both land and oceans, but more so over land areas. The possible explanations include insolation, cloud cover and land use.
4. The temperature variations recorded in the lowermost troposphere are generally reflected at higher altitudes too. In the stratosphere, however, a temperature ‘pause’ commenced in around 1995, 5–7 years before a similar temperature ‘pause’ began in the lower troposphere near the planet’s surface. The stratospheric temperature ‘pause’ has now persisted for about 25 years.
5. The 2015–16 oceanographic El Niño was among the strongest since the beginning of the record in 1950. Considering the entire record, however, recent variations between El Niño and La Niña are not unusual.
6. Since 2004, when detailed recording of ocean temperatures began, the global oceans above 1900 m depth have, on average, warmed somewhat. The strongest warming (between the surface and 200 m depth) mainly affects the oceans near the Equator, where the incoming solar radiation is at its maximum. In contrast, for the North Atlantic, net cooling at the surface has been pronounced since 2004.
7. Data from tide gauges all over the world suggest an average global sea-level rise of 1–1.5 mm/year, while the satellite record suggests a rise of about 3.2 mm/year, or more. The noticeable difference in rate (a ratio of at least 1:2) between the two data sets still has no broadly accepted explanation.
8. Since 1979, Arctic and Antarctic sea-ice extents have had opposite trends, decreasing and increasing, respectively. Superimposed on these overall trends, however, variations of shorter duration are also important in understanding year-to-year variations. In the Arctic, a 5.3-year periodic variation is important, while for the Antarctic a variation of about 4.5-years’ duration is seen. Both these variations reached their minima simultaneously in 2016, which explains the simultaneous minimum in global sea-ice extent. This particularly affected Antarctic sea-ice extent in 2016.
9. Northern Hemisphere snow cover extent undergoes important local and regional variations from year to year. Since 1972, however, snow extent has been
largely stable.
10. Tropical storms and hurricanes have displayed large annual variations in accumulated cyclone energy (ACE) since 1970, but there has been no overall trend towards either lower or higher activity. The same applies for the number of continental hurricane landfalls in the USA, in a record going back to 1851.

