
On the fatal flaw of climate alarmism
NOAA and NASA can be counted on virtually every month or year end to religiously and confidently proclaim that the latest global average surface temperature (GAST) is among the warmest on record. Back in the 1970s when an assessment of a global temperature was first attempted, the scientists recognized that even land-only surface temperature data was a significant challenge given that most of the reliable data was limited to populated areas of the U.S, Europe and eastern China with just spotty often intermittent data from vast land areas elsewhere.
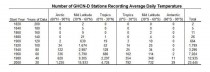
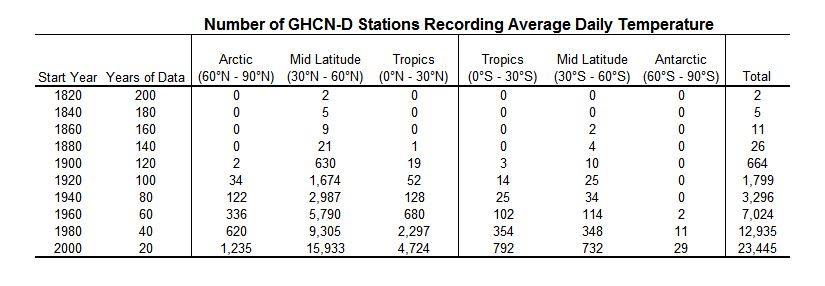
There were just 26 stations in 1880, only 4 in the southern hemisphere. Even in 1900, the 664 global stations was on 2.8% of the number in 2000.
Temperatures over oceans, which covered 71% of the globe, were measured along shipping routes mainly in the Northern Hemisphere erratically and with varying measurement methods. Despite these shortcomings and the fact that absolutely no credible grid level temperature data existed over the period from 1880 to 2000 in the Southern Hemisphere’s oceans (covering 80.9% of the Southern Hemisphere), global average surface temperature data estimation and publication by NOAA and NASA began in the early 1990s.
To illustrate the problem, on January 16, 2020, the WSJ published a lead article by Robert Lee Hotz stating: “NASA, NOAA ranked 2019 as the second-hottest year in tracking data to 1880. The world experienced near-record global temperatures in 2019, federal climate scientists said. —.” This claim was made despite the fact that absolutely no credible temperature data exists over this period for more than 40% of the planet (0.5*0.809 =0.4+).
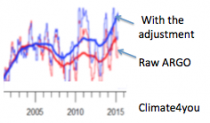
After 2000, there were diving buoys. But when the best technology designed specifically for the purpose, the ARGO buoys, disappointed by showing no upward trend, the data from the buoys was “adjusted.” John Bates, data quality officer with NOAA admitted “They had good data from buoys…and “corrected” it by using the bad data from ships. You never change good data to agree with bad, but that’s what they did – so as to make it look as if the sea was warmer.” He retired after that change was made.
That was just the latest example of data manipulation. Initially, this global data had a cyclical pattern similar to previously reported Northern Hemisphere data (high in the 1930s and 40s, low in the 70s). Then, as time progressed, the previous officially reported GAST data history was modified, removing the cycle and creating a more and more strongly upward sloping linear trend in each freshly reported historical data set.
————–
Peer reviewed, published and readily reproducible research has shown that: “The conclusive findings were that the three GAST data sets are not a valid representation of reality.”
“In fact, the magnitude of their historical data adjustments, which removed their cyclical temperature patterns are completely inconsistent with published and credible U.S. and other temperature data. Thus, despite current assertions of record-setting warming, it is impossible to conclude from the NOAA and NASA data sets that recent years have been the warmest ever.”
Current climate policies – based on these unreliable temperature records – threaten our economic and national security interests. As the proposed climate policies grow more extreme, the consequences of allowing this record to remain unchallenged gravely threatens an onslaught of litigation based on the greenhouse gas endangerment finding. Importantly, this litigation imposes significant impediments to the mineral land leasing and pipeline infrastructure build out necessary to maintain and enhance energy independence and economic prosperity.
Furthermore, the US financial sector has already dramatically curtailed its support of conventional energy source development in large part due to the continued calls for regulatory destruction of the fossil fuel industry based substantially on NOAA and NASA’s now invalidated global surface temperature records. This situation is putting our Nation’s energy security at grave risk ‘ which means our economic and national security are also in great peril.
———-
ADDENDUM to the Research Report entitled: On the Validity of NOAA, NASA and Hadley CRU Global Average Surface Temperature Data & The Validity of EPA’s CO2 Endangerment Finding, Abridged Research Report, Dr. James P. Wallace III, Joseph S. D’Aleo ABD, Dr. Craig D. Idso, June 2017
The June 2017 Research Report provides ample evidence that the Global Average Surface Temperature (GAST) data was invalidated for use in climate modelling and for any other climate change policy analysis purpose. However, there was one very critical science argument that this report did not make, which is made here.
This critical point involves whether or not it was even possible to compute a mathematically proper GAST data set over the period 1900-2000 in the first place. Claims of record-setting GAST were made as one of the three Lines of Evidence of the 2009 GHG/CO2 Endangerment Finding. Another Line of Evidence purported that climate models, tuned to fit this GAST data, were adequate for policy analysis purposes. The third Line of Evidence for validation required credible Surface Temperature data as well. However, as stated in the aforementioned GAST Research Report:
“The conclusive findings of this research are that the three GAST data sets are not a valid representation of reality. In fact, the magnitude of their historical data adjustments, that removed their cyclical temperature patterns, are totally inconsistent with published and credible U.S. and other temperature data. Thus, it is impossible to conclude from the three published GAST data sets that recent years have been the warmest ever – despite current claims of record setting warming. Finally, since GAST data set validity is a necessary condition for EPA’s GHG/CO2 Endangerment Finding, it too is invalidated by these research findings” (1)
Thus, in this GAST report, ample evidence was provided that the current officially reported GAST data are simply not credible, therefore invalidating the 2009 Endangerment Finding. However, there is a proof that is far easier to understand. Over the period 1900-2000, there is virtually no credible surface temperature data available for at least 40% of the surface of the Earth. This follows from the fact that the Southern Hemisphere’s surface is over 80% ocean (.50*.80=40), and essentially no credible temperature data was captured for these vast oceans over this time period. (2)
Hence, it never made any sense to even attempt to compute a GAST data set over this time period unless the purpose was to construct a temperature data set that could be made to have virtually any pattern over that time period that the institutions involved desired to portray as reality. In truth, with literally no credible temperature data available for well over 40% of the Earth’s surface, these institutions were only limited by what was credible to the outside world. (3) Thus far, not knowing these facts, all relevant parties, e.g., regulators, environmentalists, and government officials, have been far too accepting of the GAST record as a valid global temperature database. Since GAST data has now been separately proven to not be a valid representation of reality, it also means that the 2009 CO2 Endangerment Finding has been once again invalidated.
Footnotes
(1) GAST Data Research Report – see page 4.
(2) Southern Hemisphere “The South Atlantic, the South Pacific, the Indian Ocean and several seas, including the Tasman Sea between Australia and New Zealand and the Weddell Sea next to Antarctica, constitute approximately 80.9 percent of the Southern Hemisphere. Land constitutes about 19.1 percent. In the Northern Hemisphere, on the other hand, most of the area is comprised of land masses.”
(3) “According to overseers of the long-term instrumental temperature data, the Southern Hemisphere record is “mostly made up”. This is due to an extremely limited number of available measurements both historically and even presently from the south pole to the equatorial regions.
In 1981, NASA’s James Hansen et al reported that “Problems in obtaining a global temperature history are due to the uneven station distribution (40), with the Southern Hemisphere and ocean areas poorly represented,” – – – – (Science, 28 August 1981, Volume 213, Number 4511)
In 1978, the New York Times reported there was too little temperature data from the Southern Hemisphere to draw any reliable conclusions. The report, prepared by German, Japanese and American specialists, appeared in the Dec. 15 issue of Nature, the British journal and stated that “Data from the Southern Hemisphere, particularly south of latitude 30 south, are so meager that reliable conclusions are not possible,” the report says.
“Ships travel on well-established routes so that vast areas of ocean, are simply not traversed by ships at all, and even those that do, may not return weather data on route. Attempting to compile a ‘global mean temperature’ for 70% of the earth from such fragmentary, disorganized, error-ridden and geographically unbalanced data is more guesswork than science.
As to sea surface temperatures (SST), this data is even more fragmentary than the air temperature readings. Prior to around 1940, SST was collected by throwing buckets over the side of a ship, hoisting it on deck and dipping a thermometer in it. Bucket data is only useful for immediate weather prediction purposes, not for long-term statistical climatic analysis. Any other data collected in such bizarre ways would be laughed out of any other scientific forum.”
“Since the 1980s and 1990s we have satellites to measure SST [22] using infra-red sensors (not to be confused with the MSU instruments which measure the atmosphere). Unfortunately, satellites sensing SSTs in the infra-red can only see the immediate water surface, not the water even a few centimetres deeper. This is because infra-red radiation at these wavebands (around 10 microns) cannot penetrate water at all, and so the satellite can only ‘see’ that top millimetre. This can result in both warm and cool errors. On hot still days, the top centimetre of the ocean surface can be much warmer than waters a few centimetres deeper, similar to the same phenomenon which can be observed in any undisturbed outdoor swimming pool. On windy days, there is no such difference due to wave mixing. There is also an intermittent ’thermal skin effect where the top millimetre of water on calm seas can be up to 0.3C cooler than the water just beneath the ‘skin’ due to evaporation taking place on the surface. For these reasons, SSTs taken from satellites are only accurate to within a few tenths of a degree, adequate for immediate meteorological purposes or detecting an El Nino, but not suited to measuring subtle global climatic changes of a few tenths of a degree.” John Daly
========
See the Superbowl of Data Tampering by Tony Heller:
————–

