By Paul Homewood
As study after study shows, real-world data keeps telling us that global warming is not making hurricanes worse.
A new study by Roger Pielke Jr and Ryan Maue based on global landfall data since 1970 has confirmed this yet again:

In 2019 the three most costly catastrophes were the consequence of tropical cyclones, according to the reinsurance company Munich Re. Typhoons Hagibis and Faxai struck Japan, together causing more than $26 billion in losses and Typhoon Lekima caused more than $8 billion in losses across Asia.
Tropical cyclones, which are called hurricanes in the Atlantic and eastern Pacific between Hawaii and Mexico, are historically responsible for the greatest amount of damage among weather and climate related events. Understanding the behavior of tropical cyclones on planet earth is thus a priority among scientists, and includes attention to short-term forecasting and long-term climate trends.
The storms that cause the most risk to human life and property damage are those that that make landfall, technically defined as occurring when the eye of a tropical cyclone passes over the coastline. Storms with winds of at least 74 miles-per-hour (119 kilometers-per-hour) are classified as hurricane strength, and those with winds of 111 miles-per-hour (178 kilometers-per-hour) or greater are classified as major hurricane strength. Overall, on planet earth each year there are about 45 tropical cyclones that reach hurricane strength and about one third of those go on to make landfall. Of those 45 storms, about 25 storms reach major hurricane strength and 5 of them, on average, go on to make landfall.
Almost a decade ago we realized that the scientific community had never developed a historical time series of tropical cyclones that made landfall around the world. So along with Jessica Weinkle, today a professor at the University of North Carolina-Wilmington, we used datasets available around the world on tropical cyclones to create a historical record of storms of at least hurricane strength that make landfall. Last year we were asked by a group of scientists affiliated with the World Meteorological Organization to update our analysis.
Today we can share with you a preliminary further update, as part of our work in progress (Caveat Lector!) to develop a new and improved analysis of landfalling tropical cyclones. Our updated analysis is made possible by the data of the project on the International Best Track Archive for Climate Stewardship (Version 4). We are grateful to the governments that support this work and the scientists who conduct the analyses. Note that global data prior to 1985 has larger uncertainties, but landfalls that have occurred during the satellite era of observations are highly unlikely to have been missed. Even so, the further back in time, the greater the chances are that our figures are underestimates.
Comprehensive data on landfalling tropical cyclones in ocean basins around the world are available since 1970. Defining landfall can be tricky – for instance, sometimes storms come very close to a coast but do not actually make landfall and our methods do not include all small islands (and for the all of the specific and technical details of our methods, please see our paper).
The graph below shows 50 years of global landfalls of tropical cyclones of hurricane strength, based on the Saffir-Simpson hurricane scale use by the U.S. National Oceanic and Atmospheric Administration.
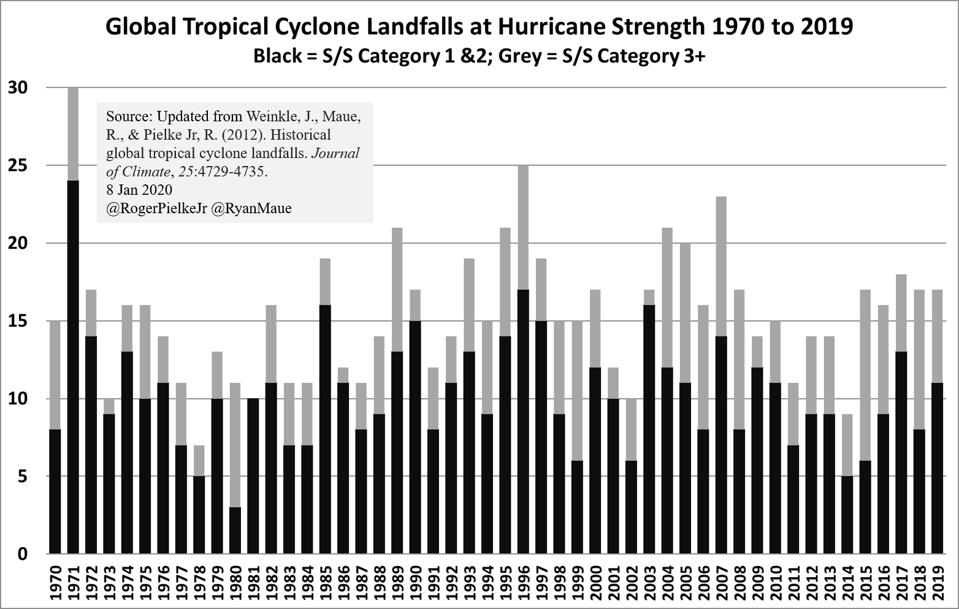
Global tropical cyclone landfalls at hurricane strength 1970 to 2019
There are a lot of ups and downs in the data, but no obvious trends. Last year saw 17 total storms, with 7 making landfall as major hurricanes. Every landfalling hurricane poses significant risks to life and property, but the major hurricanes are responsible for the most damage. Of course, tropical cyclones, even those that never reach hurricane strength, can also create massive damage through heavy rains and flooding.
Full details here.
None of this will, of course, stop the usual suspects, from Michael Mann and Katharine Hayhoe to the BBC and David Attenborough, claiming the opposite.
#
Excerpts:
Last year (2019) saw 17 total storms, with 7 making landfall as major hurricanes. Every landfalling hurricane poses significant risks to life and property, but the major hurricanes are responsible for the most damage. Of course, tropical cyclones, even those that never reach hurricane strength, can also create massive damage through heavy rains and flooding.
Here are some summary statistics on landfalling hurricanes from 1970 to 2019:
- All landfalls: 15 (median), 15.4 (average), 4.3 (sd)
- Categories 1 & 2 at landfall: 10, 10.4, 3.7
- Category 3+ at landfall: 5, 5.0, 2.6
- Most total landfalls in one year: 30 (1971)
- Fewest total landfalls in one year: 7 (1978)
- Most Category 3+ landfalls in one year: 11, (2015)
- Fewest Category 3+ landfalls in one year: 0 (1981)
- Most total landfalls over a 10-year period: 177 (1988-1997)
- Fewest total landfalls over a 10-year period: 120 (1975-1984)
- Total landfalls 2010-2019: 148
- Most Category 3+ landfalls over a 10-year period: 65 (1999-2008)
- Fewest Category 3+ landfalls over a 10-year period: 33 (1972-1981 and 1978-1987)
- Total Category 3+ landfalls 2010-2019: 60
- Total landfalls 1970-2019: 772, (520 were Categories 1 & 2, 252 were Category 3+)
It is well known that the 1970s were a relative quieter period for tropical cyclones overall as compared to the 1990s, and parts of recent decades.
…
These data help to illustrate why it is so challenging to identify trends in tropical cyclones, even over periods of 50 years or more. Over the most recent 50 years, the decadal minimum worldwide was 120 landfalling storms of hurricane strength (1974 to 1983) and the landfalling maximum was 177 (1988 to 1997), a difference of almost 50% from smallest to highest (which happened over a total period of just 25 years). For tropical cyclones of major hurricane strength the decadal variability is even larger, with the fewest at 33 (twice) and the most at 65 (1999-2008), or almost a 100% difference.