https://cliscep.com/2019/07/29/1947-an-anti-hysterical-perspective-on-modern-european-heatwaves/
by JAIME JESSOP
2003. 2018 and now 2019: very hot (record-breakingly hot) conditions affect parts of central and northern Europe, with 2003 being by far the most significant and prolonged event. Cue, climate change hysteria from the warmist media, whacko climate crisis obsessed eco-loonies and AGW-biased scientists in search of research grants, prestige and a ‘noble cause’ for which to promote urgent action. As usual though, history often tells a less sensational tale, providing perspective on the current ‘end of the world’ narrative being perpetuated by the MSM and by emotionally and psychologically damaged members of the climate change end times Twitterati. You think I’m exaggerating? I’m not.
As it happened, 25th July 2019 wasn’t the day Britain transitioned to a ‘new climate’, because the temperature record of 38.5C set in the ‘old climate’ back in 2003 was not broken (except by iffy thermometers in Cambridge Uni’s Botanical gardens, that is). But you know how it is, Little England, being the backward, rain-soaked, cake-filled, cloud-bolted little island of grey skies, xenophobes and racists that it is, can’t be expected to immediately join continental Europe in heralding the terrifying arrival of the ‘new normal’. Germany, Belgium, Netherlands and Paris all transitioned on July 25th. Boris might make matters even worse on Halloween if he takes us ‘out of Europe’ without a deal, then God only knows how long it will be before climate alarmists can say that Britain is definitely CCBAR (climate changed beyond all recognition).
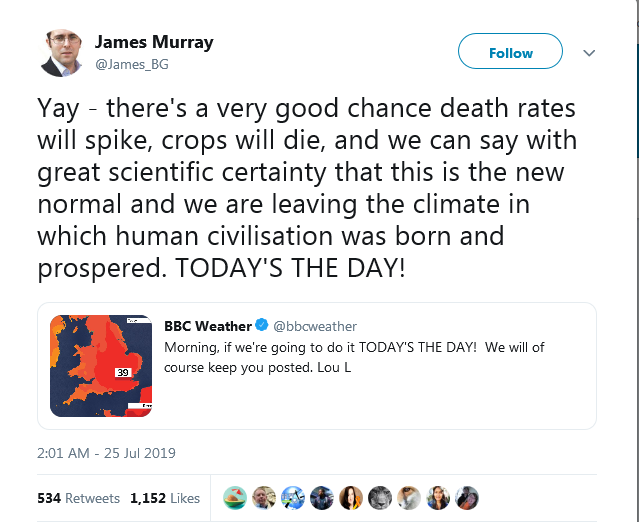
July 25th, though it didn’t see the UK transition from a benign climate to something much, much more horrible, did witness a significant rift open up between different factions of the Green blob: i.e. the opportunist BBC – who’ve bought in to the climate crisis purely for ideological reasons, and because they’re rabid, globalist lefties anyway – and those nutters who genuinely believe that we are all going to die in a few years time. The latter got quite upset at those caught ‘celebrating’ the imminent ‘hottest day evah’ in Britain. They were celebrating for the simple reason that it reinforced their catastrophe narrative. The ‘serious’ fanatics really do believe that a few very hot days are a prelude to the end of the world and they really do believe that the Beeb was being outrageously flippant. It’s quite comical.
Environmentalists who criticised the BBC for tweeting enthusiastically about the ongoing heatwave have been mocked online for their hysterical reaction.
Campaigners including the Green Party and charity WWF heaped scorn upon the Corporation for the lighthearted tone it used when reporting the heatwave on social media.
As it happens, both factions were to be bitterly disappointed. The Met Office and the BBC didn’t get to crack open the chilled Champers and the eco-loons at GreenPiss, the Green Party, XR and WWF – plus the rest of the doom-filled Thermageddon-fixated adorers of Saint Greta – didn’t get to be really, really miserable. Shame. Never mind.
But anyway, enough of the entertainment; let’s get to the boring, ‘sciency’, fact-orientated bit. Why isn’t a few extremely hot days in Europe this year proof of a climate crisis?
The 1947 heatwave was more severe in Central Europe than 2003
In 2013, scientists from the Oeschger Centre for Climate Change Research and Institute of Geography, University of Bern, Switzerland analysed the heatwaves in Switzerland during 1947 using Meteo-Swiss weather records and the 20th Century Reanalysis (20CR) dataset based on NCEP. Here is what they found:
The heatwaves of 1947 can be compared with the events of 2003 in terms of intensity and duration.
The meteorological situation was characterized by a high-pressure bridge over Central Europe.
This report focuses on the heat period of 1947 in Switzerland. The summer of 1947 marked the culmination of a prolonged drought period that affected central Europe from around 1945 to the early 1950s.
The authors make it clear that it was atmospheric dynamics (circulation patterns/blocking high) which primarily caused the heatwave – just like in 2003, 2018 and now 2019.
The variability of air temperature in general and of extreme temperature events in particular is governed by atmospheric circulation. In particular, persistent high-pressure systems and associated circulation patterns may lead to positive anomalies of surface air temperature affecting a large area over prolonged time periods (Kysely and Huth, 2008). Heatwaves are often caused by quasi-stationary anticyclonic circulation anomalies or atmospheric blocking, which may be sustained or amplified by land-atmosphere feedbacks (IPCC, 2012). This is also the case for the region under study (Rüttimann et al., 2009).
Here are the anomalies over Europe in 1947 for Apr-Jun (left) and Jul-Sep (right) (Hadcrut 3) with respect to 1981-2010. You can see the heatwave was firmly centred over Central Western Europe and covered a huge area way beyond Switzerland, which country was not even at the epicentre.
In the analysis of the maximum temperature from the 14 meteorological stations, 29 July was the hottest day during summer 1947. The mean maximum temperature from all lowland (<560 m a.s.l.) stations on this date was 36.1 °C; 26.4 °C were reached at 2502 m a.s.l. In Basel 38.7 °C were measured – the highest recorded temperature during the heat period of 1947 and the highest temperature ever observed in Switzerland until 2003 (note, however, that the Wild screen used at that time in Basel was sensitive to radiation errors, see Auchmann and Brönnimann, 2012).
The heat period of 1947 can be compared with the year 2003 in terms of maximum temperatures and duration of the heatwaves. For instance, the maximum temperature anomaly, computed as departures from the 1961-1990 average, of the year 1947 amounted to 5 °C. This is only 1 °C less than for the year 2003. Another aspect is that in Basel, the threshold of 30 °C was exceeded 49 times in 1947, more often than in 2003 (41 times).
The period of consecutive days during which the maximum temperature exceeded the 90% quantile of the summer temperature was also longer in 1947 than in 2003. During the year 1947 the longest heatwave lasted 14 days from 22 July to 4 August, whereas in 2003 only twelve consecutive heat days were recorded at the beginning of August (Z’Graggen, 2006; Beniston, 2004).
The meteorological situation during the heatwave event in 1947 analysed with the 20CR dataset shows typical features of a heatwave. The stationary high pressure system over the study region – the Central-European High – during the episode from the 22 July to 4 August 1947 is conductive for a heatwave according to Kysely and Huth (2008).
The analysis of the heatwaves in 1947 indicates that the event is comparable to 21stcentury heat periods such as the summer 2003 and that 1947 was extraordinary.
Even if the heatwave 2003 exceeded the maximum temperatures measured in 1947, in terms of the length of a heatwave and the exceedance of the 30 °C temperature threshold, the heat period 1947 was more intense.
So it’s fairly clear that:
- 1947 was comparable to 2003 and both heatwaves were caused by very similar meteorological patterns.
- 1947 maximum average temperatures were just 1C less than 2003
- In terms of duration and number of days above 30C, 1947 was more intense
Given that summers in Europe have warmed significantly since 1950, it is perhaps not surprising that the daily average maximum temperature in 2003 exceeded that in 1947, but that’s the only real difference and by all other metrics, 1947 was more intense. Not forgetting also that urbanisation has increased since 1947 and land use has changed considerably, either of which may have contributed to generally higher temperatures. So, if you’re looking for the climate change signal in the heatwave of 2003, the increase in mean maximum temperature anomaly of 1C is it. Scary (not). Climate crisis (not). But Peter Stott et al say different:
Dramatically increasing chance of extremely hot summers since the 2003 European heatwave
A study by Christidis, Jones and Stott published Dec 2014 claims:
The vulnerability of European citizens was made evident during the summer heatwave of 2003 (refs 3, 4) when the heat-related death toll ran into tens of thousands5. Human influence at least doubled the chances of the event according to the first formal event attribution study6, which also made the ominous forecast that severe heatwaves could become commonplace by the 2040s. Here we investigate how the likelihood of having another extremely hot summer in one of the worst affected parts of Europe has changed ten years after the original study was published, given an observed summer temperature increase of 0.81 K since then.
Using a previously employed temperature threshold to define extremely hot summers, we find that events that would occur twice a century in the early 2000s are now expected to occur twice a decade. For the more extreme threshold observed in 2003, the return time reduces from thousands of years in the late twentieth century to about a hundred years in little over a decade.
Note the emphasis is on frequency of recurrence. Stott’s original attribution study of the 2003 heatwave categorised the event as:
. . . . . probably the hottest in Europe since at latest ad 1500
Thereby classing it as a millennial scale event. However, we’ve just seen that 1947 was comparable to 2003 and only 1C cooler in terms of mean absolute maximum temperature. Also, the summer of 1541 was likely hotter, drier and far more intense than even 1947 or 2003. Stott paints the 2003 heatwave as some momentous event in the history of European weather and claims that, because of man-made climate change, such events are going to be ‘the new normal’ by the end of the 21st century. Stott is wrong about the uniqueness of 2003 in modern European meteorological history. 1947 was worse. 1976 was definitely worse – in the UK at least.
We’ve seen two heatwaves in Europe in 2018 and 2019, of similar intensity to 2003, but of shorter duration and impact (especially so far in 2019), with the 2018 heatwave being centred more over Scandinavia, the UK and Ireland – similar to 1976. Also, very inconveniently, many areas of Europe and Russia have experienced record summer minimum temperatures in 2019, whilst other parts were baking, but you didn’t hear about that in the media. But even so, perhaps Stotty is right about the increased probability of European heatwaves? Maybe they are becoming hotter and a lot more frequent due to man-made climate change? The climate fanatics certainly think so. To investigate this possibility though, we have to look at atmospheric dynamics, not just simple thermodynamics and, as it turns out, the answer is not that simple. Science and observations get in the way of warmist hyperbole. Bummer.
Observed 21st Century Increase of Jet Stream Blocking Events
A study published in April this year states:
The summer of 2018 witnessed a number of extreme weather events such as heatwaves in North America, Western Europe and the Caspian Sea region, and rainfall extremes in South-East Europe and Japan that occurred near-simultaneously. Here we show that some of these extremes were connected by an amplified hemisphere-wide wavenumber 7 circulation pattern. We show that this pattern constitutes an important teleconnection in Northern Hemisphere summer associated with prolonged and above-normal temperatures in North America, Western Europe and the Caspian Sea region. This pattern was also observed during the European heatwaves of 2003, 2006 and 2015 among others. We show that the occurrence of this wave 7 pattern has increased over recent decades.
So what exactly has happened and can what has happened be attributed to anthropogenic influence?
Over recent decades the number of phase-locked wave-7 events (here defined as weeks with above average wave-7 amplitude within its preferred position, see figure S4) have increased significantly (95% confidence interval, figure 4(b)). Prior to 1999 there were no summers with two or more consecutive weeks of a wave 7 phase-locked circulation, but since then these have occurred (table S2). Thus, the persistence of such situations appears to have increased. In fact, the average duration has doubled from about one to two weeks per year, while the number of years with more than two events per summer shows an almost eight-fold increase (figure S7). Although the trends are always upward, i.e. independent of the amplitude threshold used, their significance is sensitive to the amplitude threshold due to the reduction in ensemble size for high amplitudes (figure 4(b)). The number of wave-7 events (i.e. weeks with a high-amplitude wave-7 irrespective of its phase position) do not show statistically significant upward trends for different thresholds used (figure 4(a)). A statistically significant upward trend in the observed amplitude of summertime wave-7 is only detected when data from the pre-satellite period is included (figure S8). The more pronounced trends in phase-locked events (figure 4(b)), compared to high-amplitude events (figure 4(a)) suggests that it is the phase-locking itself that has increased. In general, these trends can simply reflect multi-decadal variability in the Earth system given that the satellite record is relatively short. Nevertheless, an enhanced land-ocean temperature contrast as a consequence of amplified land warming provides a physical mechanism for such waves to become preferentially phase-locked. Such temperature contrast creates an increased zonal temperature gradient at the coastlines and provide a stationary vorticity source that triggers and maintains atmospheric waves [30, 31]. It is therefore possible that the relative position of land and ocean areas in the mid-latitudes with high values of dT/dx over the continental West-coasts could favor a hemispheric wave 7 pattern [32]. Such contrast would further be enhanced by the cooling trend of northern Atlantic sea surface temperatures linked to a slowdown of the Atlantic Meridional Overturning Circulation [33] and implicated in past European heat extremes [23] but this needs further investigation.
So, what the authors are saying here is that there is no trend in wave 7 phase locking events which would give rise to particularly hot summers in western Europe over the period of satellite observation, but that there is a very significant increase in phase locking events after 1999, which has resulted in a number of hot summers in Europe, including the very hot summer of 2003 and the memorable hot dry early summer of 2018 in north western Europe. What they say is that natural multidecadal variability may be the cause behind this change but that it’s plausible it may be due to Arctic warming, which implies anthropogenic causes (though note that this is only the case if such warming is attributable largely to anthropogenic causes).
Take home message: no increase in blocking over the period of satellite observations, only a 21st century increase which may be due to natural causes or possibly anthropogenic influence. More research needed.
1947 was a circulation-induced heatwave analogous to modern heatwaves
An interesting new study looking at 1947 as an analogue of more recent European heatwaves was published in May this year and Friederike Otto is among the authors. It’s rather better science, I must say, than the shockingly poor event attribution which was plugged by the media as ‘proof’ that the recent record breaking heatwave in France was man-made, which she also co-authored. The abstract says:
The science of extreme event attribution has rapidly expanded in recent years, with numerous studies dedicated to determining whether and to what extent anthropogenic climate change has increased the likelihood of specific extreme weather events occurring. However, the majority of such studies have focussed on extreme events which have occurred in the recent past (usually within the past 10 years) while minimal research efforts have considered the multitude of high-impact extreme climatic events which occurred throughout the instrumental record.
Using a reanalysis-based dataset, our results show changes in the frequency of 1947-like extreme heat throughout the twentieth century to be highly sensitive to methodological choices, particularly in the context of disaggregating dynamic and thermodynamic changes in the risk of extreme heat. Evidence also suggests clear decadal variability in the occurrence of circulation patterns conducive to the 1947 heatwaves.
The authors make the clear distinction between dynamic and thermodynamic influences when considering attribution of extreme events like European heatwaves:
Since European heatwaves are known to preferentially occur in the presence of specific summertime atmospheric circulation states (Cassou et al. 2005; Pfahl and Wernli 2012; Sousa et al. 2018; Jézéquel et al. 2018b), it is important to understand how dynamic and non-dynamic processes leading to heatwaves are each affected by anthropogenic climate change. Consequently, a second topic of recent research for the attribution community has concerned the extent to which changes in the likelihood of a particular extreme event occurring can be further separated into dynamic and thermodynamic contributions (Trenberth et al. 2015; Shepherd 2016; Otto et al. 2016; Harrington 2017).
The authors then define the 1947 European heatwave and identify it as the focus of their study:
This study focuses on the anomalously hot summer of 1947 over Central Europe as a case study to examine the time-evolution of attribution statements, as well as the efficacy of circulation analogues as a tool for probabilistic event attribution. As discussed extensively in Grütter et al. (2013, hereafter G13), the summer of 1947 was a period of pronounced heat over large regions of Central Europe, and occurred during the middle of a five-year period of drought which affected the region between 1945 and 1949 (Hirschi et al. 2013).
The period of April-September 1947 witnessed record-breaking rainfall deficits over Switzerland, which by some estimates were up to twice as severe as for the summer of 2003 (Calanca 2007). This widespread dryness helped to exacerbate the favourable meteorological conditions for extreme heat in Central Europe: in this case, such conditions were characterised by a persistent high-pressure system over Central Europe and several low pressure systems forming to the west of the British Isles contributing to significant heat advection from the south-west. The severity and length of this anomalous heat during the summer of 1947 lead to widespread forest fires in Germany, as well as a near-total loss of crops across Switzerland (Grütter et al. 2013).
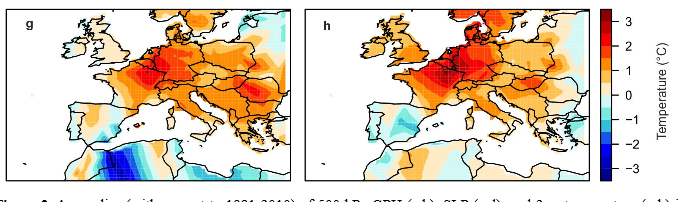
![Screenshot_2019-07-29 Circulation analogues and uncertainty in the time-evolution of extreme event probabilities evidence f[...]](https://cliscep.files.wordpress.com/2019/07/screenshot_2019-07-29-circulation-analogues-and-uncertainty-in-the-time-evolution-of-extreme-event-probabilities-evidence-f....png?w=700)
The above graphic shows the absolute Jul-Aug temperature anomalies in Europe in 1947 compared to the 1901-2000 base period.
Obviously not a flash in the pan. A very significant meteorological event which, as we have already seen, is comparable to, and even more severe in retrospect than 2003. Emissions of greenhouse gases had yet to take off in 1947 and it was 11 years before direct measurements of atmospheric CO2 began at Mauna Loa. It’s quite likely that CO2 has increased by more than 100ppm since 1947 and that atmospheric concentrations of GHGs were far closer to pre-industrial concentrations when Europe experienced this very significant mid 20th century heatwave. It therefore defies reason that radiative forcing from GHGs could have played any significant role in that event.
The authors of the study were interested in the evolving probability of “witnessing circulation features similar to those which coincided with the 1947 heatwave through the twentieth century”. Here is what their analysis revealed:
![Screenshot_2019-07-29 Circulation analogues and uncertainty in the time-evolution of extreme event probabilities evidence f[...] (2).png](https://cliscep.files.wordpress.com/2019/07/screenshot_2019-07-29-circulation-analogues-and-uncertainty-in-the-time-evolution-of-extreme-event-probabilities-evidence-f...-2.png?w=700)
Clear multidecadal variability. The authors state that “there is no clear positive trend through time in the likelihood of witnessing daily circulation patterns like those of the 12 days of the 1947 extreme heatwave” and furthermore that there are “some individual decades—like the 1940s in Fig. 4d—which can show statistically significant probabilities of witnessing 1947-like MSLP patterns”. The authors further state:
Up until the 1940s—and to a lesser extent for those 20-year periods ending in the 1970s—the probability of witnessing 12-day MSLP sequences analogous to the 1947 heatwave event was substantially lower than average. Meanwhile, for every 20-year period since 1976–1995, there are substantive increases in the likelihood of witnessing such circulation analogues, with probability ratios reaching between three and six for in the most recent decades. While these results appear to qualitatively resemble corresponding changes in the Atlantic Meridional Oscillation over the same period (Sanderson et al. 2017), decomposing the relative effects of low-frequency modes of variability versus changes to European aerosol or greenhouse gas emissions (King et al. 2016; Undorf et al. 2018) is beyond the scope of this analysis.
So what we have here is the high likelihood that multidecadal variability is dictating the probability of circulation patterns occurring which would result in extreme heatwaves in Europe like 1947, 2003, and 2018. But dynamics are only one side of the equation. What about absolute temperatures?
For the case of general summertime temperatures, a clear warming signal is found through the twentieth century, with increases of more than 2 °C for the twenty-year period ending in 2014 relative to the start of the 1900s. We also find for any given time period, the average of the analogue temperatures to be approximately 2 °C warmer than the corresponding mean of all daily temperatures (black line in Fig. 5a–c), an inflation consistent with previous studies (Jézéquel et al. 2018b). This is clear evidence to support the notion that extreme summertime temperatures in 1947 were more likely to occur in the presence of the corresponding MSLP patterns which were also present.
The conclusion is plain: summers in Europe have got warmer due to the secular trend in warming experienced by most of the globe, but the probability of extreme summer heatwaves occurring due to particular circulation patterns shows no overall trend in the 20th century but is most likely controlled by multidecadal variability (the AMO). The authors clearly state that “no added increase in temperature anomalies is found associated when constraining on the circulation features of the 1947 heatwave, beyond the warming trends which are apparent for all summertime temperatures over the twentieth century.” Thus, Stott’s assertion that the probability of summers like 2003 and 2018 occurring has dramatically increased and will continue to do so, because of anthropogenic global warming, such that they become ‘the norm’ at the end of the 21st century is highly suspect and probably simply WRONG. If generalised warming continues, summer heatwaves will probably continue to set records but there is little evidence to suggest that they will become more frequent.
The authors do at least consider the possibility that thermodynamics have played a part in the late 20th/early 21st century increased probability of European heatwaves, but then say that dynamics could equally have been responsible:
A further consideration is whether or not warming-driven changes to background circulation patterns should be considered as part of the analogue analysis a priori. Jézéquel and colleagues (2018b) argue that mean changes to both Z500 and MSLP fields generally constitute a thermodynamic signal, and thus any overall trend in Z500 or MSLP through time should be removed before an analogue analysis to infer dynamical changes to the likelihood of extreme heatwaves is performed. While such an approach would be reasonable to account for the overall thermodynamic increase in tropospheric depth when considering Z500 trends, mean changes to MSLP could equally reflect dynamically driven changes in the prevalence of blocking high pressure systems in general, and thus could be argued as a dynamical signal (Smoliak et al. 2015; Parsons et al. 2016; Harrington et al. 2016; Lehner et al. 2017; Gibson et al. 2017; Woollings et al. 2018).
They leave open at least the possibility that anthropogenic influence may play a role in the evolution of the dynamical patterns conducive to extreme heatwaves – but don’t sound too hopeful:
In reality, no metric will serve as a perfect proxy for the weather systems conducive to an extreme heatwave event. Therefore, any attempt to look at changes in the frequency of witnessing such weather regimes—which one might consider to reflect the ‘dynamical’ component of a probability ratio—will in fact just be a partial representation of the ‘true’ role of human influence on circulation changes conducive to heatwave occurrence, with the remainder instead being (perhaps mistakenly) ascribed as a thermodynamic component of the probability ratio.
Then there’s land use changes, which have nothing to do with radiative GHG forcing of climate:
There are also further complicating aspects to the binary narrative of either thermodynamic or dynamic changes to the atmosphere combining to influence the likelihood of an extreme heatwave occurring. One example is the role of land-use changes and land–atmosphere feedbacks. Antecedent soil moisture anomalies can modulate the potential severity of a heatwave (Seneviratne et al. 2010), and these processes can be further influenced by anthropogenic changes to land use over the twentieth century unrelated to climate (Cook et al. 2009; Lejeune et al. 2018). Such issues have not been addressed in this analysis, and warrant further consideration.
In conclusion:
A warming world might influence how often weather patterns conducive to exceptionally hot weather will occur over Central Europe (Jézéquel et al. 2018a; Woollings et al. 2018), as well as how warm summertime temperature maxima will reach. However, our results show further work is needed to properly quantify the uncertainty of these changes, both to understand the evolution of changes in the past and as warming continues into the future.
Do you think there is any chance at all that the world’s media will convey this non-alarmist message to the public and do you think little Greta, who knows all about the ‘science’ of the ‘climate crisis’, will tweet the good news to her thousands of followers on Twitter? Any chance that Rupert Read of XR will go on telly and announce “OK, maybe we do have a bit more than 18 months to save the planet”? Any chance at all that the scientists involved in these studies will go public and explain that extreme heatwaves in Europe and beyond are not necessarily due to fossil fuel burning, in fact rather more likely due to natural variability? Not bloody likely!