By Kenneth Richard
The peer-reviewed scientific literature robustly affirms that land-falling hurricane frequencies and intensities have remained steady or declined in recent decades. So have droughts, floods, and other extreme weather events. But the editorial board of The Washington Post spurns this scientific evidence and inexplicably blames politicians and “those who deny” climate change for landfalling hurricanes and the associated damage. 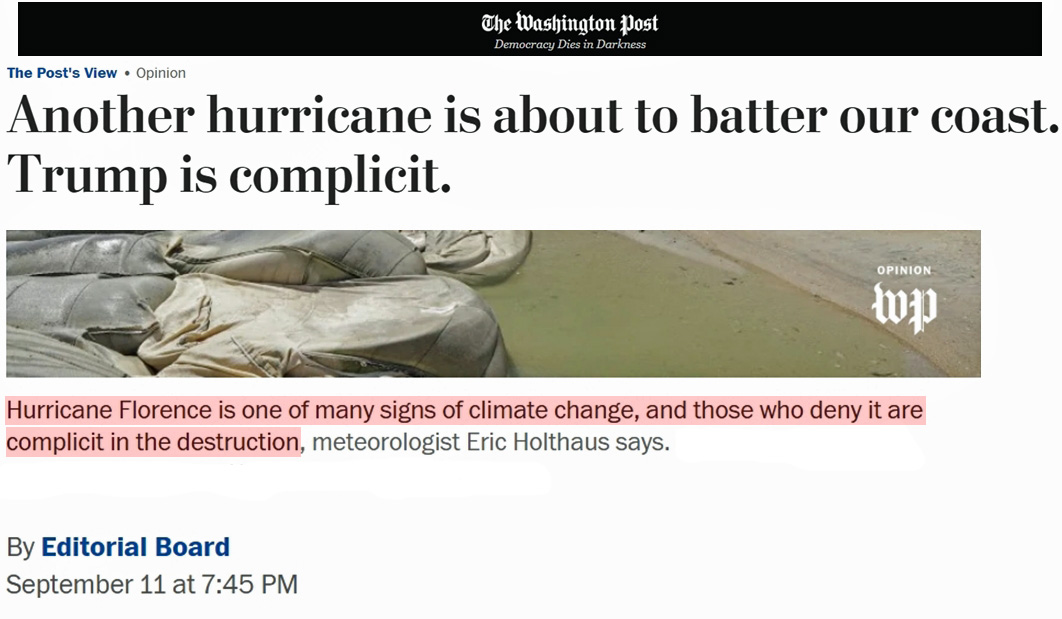
Image Source: The Washington Post 11/09/2018
It is well documented in the scientific literature that a cooler climate is associated with more weather extremes and hurricane activity, whereas a warmer climate leads to a reduction in weather extremes and hurricane activity.
“Recent review papers reported that many high-resolution global climate models consistently projected a reduction of global tropical cyclone (TC) frequency in a future warmer climate.“ (Sugi et al., 2015)
“Our work illustrates a major constraint on the large-scale global atmospheric engine: As the climate warms, the system may be unable to increase its total entropy production enough to offset the moistening inefficiencies associated with phase transitions. This suggests thatin a future climate, the global atmospheric circulation might comprise highly energetic storms due to explosive latent heat release, but in such a case, the constraint on work output identified here will result in fewer numbers of such [highly energetic storm] events. … On a warming Earth, the increase in perceptible water has been identified as a reason for the tropical overturning to slow down, and studies over a wide range of climates suggest that global atmospheric motions are reduced in extremely warm climates.“ (Laliberté et al., 2015)
“Extratropical cyclones cause much of the high impact weather over the mid-latitudes. With increasing greenhouse gases, enhanced high-latitude warming will lead to weaker cyclone activity. Here we show that between 1979 and 2014, the number of strong cyclones in Northern Hemisphere in summer has decreased at a rate of 4% per decade, with even larger decrease found near northeastern North America.” (Chang et al., 2016)
“The impact of climate change is seen in slightly decreased intensities in landfalling cyclones.” (Perrie et al., 2010)
The Washington Post editorial board has apparently decided that conclusions found in the scientific literature are subservient to their political aims.
This way they can justify blaming out-of-favor politicians and those who “deny” that humans cause extreme weather events for the devastating consequences of an impending landfalling hurricane.
Below are several scientific papers published within the last year that do not seem to support the Post‘s angle that says we can reduce hurricane landfall frequencies if only we can agree to believe, rather than deny, that humans are responsible.
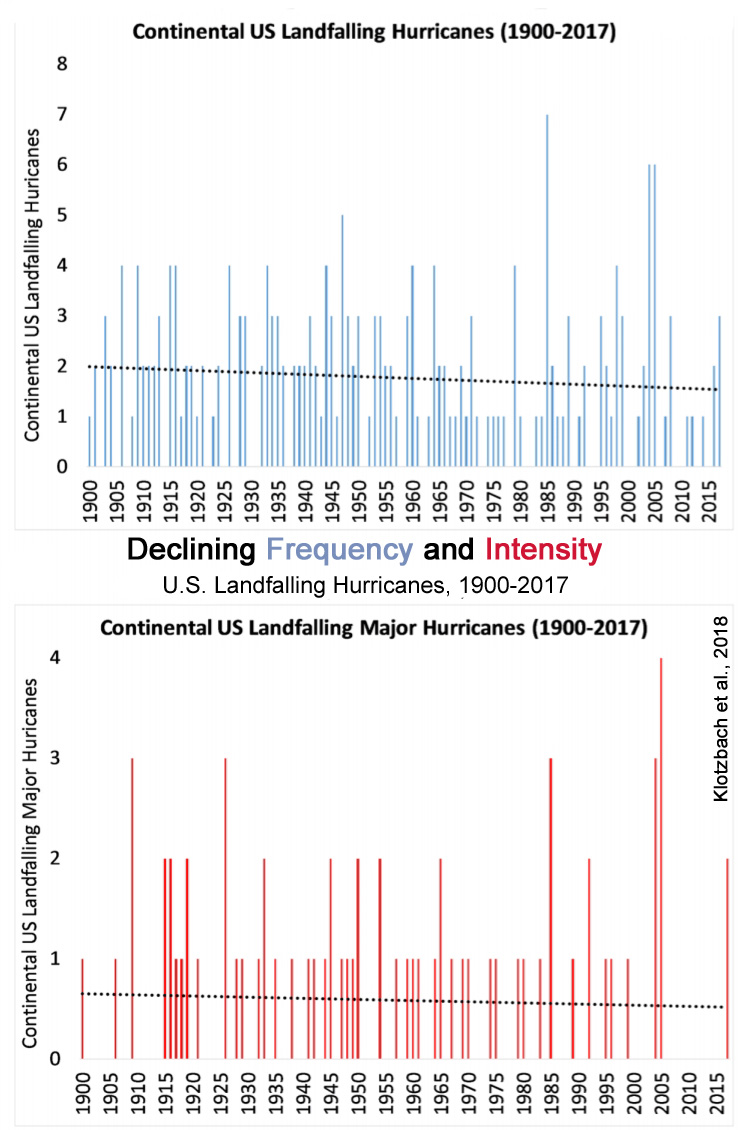
“Downward Trend Since 1950” In Landfalling Hurricane Frequency/Intensity
“The extremely active 2017 Atlantic hurricane season concluded an extended period of quiescent continental United States tropical cyclone landfall activity that began in 2006, commonly referred to as the landfall drought. We introduce an extended climatology of U.S. tropical cyclone activity based on accumulated cyclone energy (ACE) and use this data set to investigate variability and trends in landfall activity. The [hurricane landfall] drought years between 2006 and 2016 recorded an average value of total annual ACE [accumulated cyclone energy] over the U.S. that was less than 60% of the 1900–2017 average.”
“Scaling this landfall activity metric by basin-wide activity reveals a statistically significant downward trend since 1950, with the percentage of total Atlantic ACE expended over the continental U.S. at a series minimum during the recent drought period.”
“Continental United States (CONUS) hurricane-related inflation-adjusted damage has increased significantly since 1900. However, since 1900 neither observed CONUS [Continental United States] landfalling hurricane frequency nor intensity show significant trends, including the devastating 2017 season.”
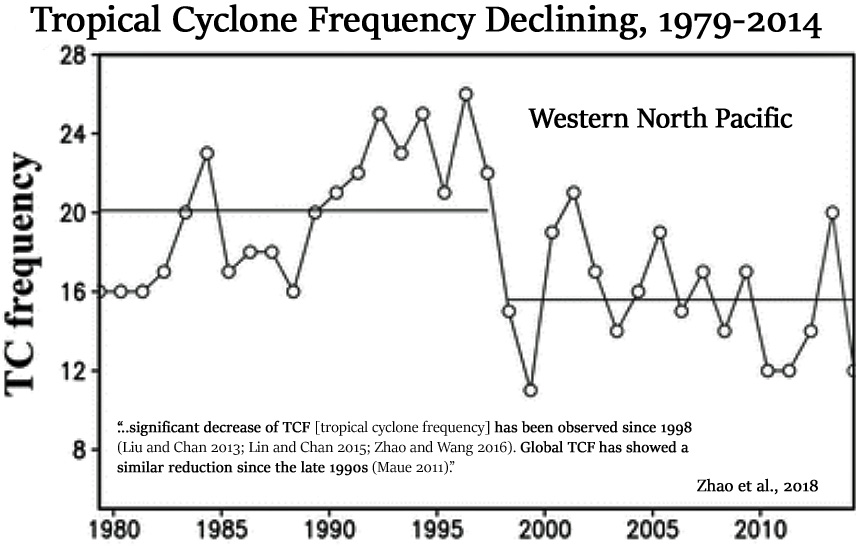
“Over the 1997–2014 period, the mean frequency of western North Pacific (WNP) tropical cyclones (TCs) was markedly lower (~18%) than the period 1980–1996. Here we show that these changes were driven by an intensification of the vertical wind shear in the southeastern/eastern WNP tied to the changes in the Walker circulation, which arose primarily in response to the enhanced sea surface temperature (SST) warming in the North Atlantic, while the SST anomalies associated with the negative phase of the Pacific Decadal Oscillation in the tropical Pacific and the anthropogenic forcing play only secondary roles.”
“A vigorous debate has currently focused on the relationship between increasing TC [tropical cyclone] activity and increasing SST [sea surface temperatures] (Knutson et al. 2010). … [O]ver the WNP [Western North Pacific] basin,a significant decrease of TCF [tropical cyclone frequency] has been observed since 1998 (Liu and Chan 2013; Lin and Chan 2015; Zhao and Wang 2016). Global TCF [tropical cyclone frequency] has showed a similar reduction since the late 1990s (Maue 2011). Change of TCF over the past few decades does not appear to be consistent with changes in local SST. Observational analyses further pointed out that there is no significant correlation between the TCF [tropical cyclone frequency] and local SST [sea surface temperatures] over the WNP [Western North Pacific] basin (Chan 2006; Yeh et al. 2010).”
“The hurricane analysis conducted by Burn and Palmer (2015) determined that hurricane activity was subdued during the [warm] Medieval Climate Anomaly (MCA) (~900-1350 CE) and became more produced during the [cold] Little Ice Age (LIA) (~1450-1850 CE), followed by a period of variability occurred between ~1850 and ~1900 before entering another subdued state during the industrial period (~1950-2000 CE). In general, the results of this study corroborate these findings.”
“[W]hile hurricane activity was greater during the LIA, it also had more frequent periods of drought compared to the MCA (Burn and Palmer 2014), suggesting thatclimate fluctuations were more pronounced in the LIA compared to the MCA. The changes in the diatom distribution and fluctuations in chl-a recorded in this study starting around 1350 also indicate that variations in climate have become more distinct during the LIA and from ~1850-1900. … [C]limate variability has increased following the onset of the Little Ice Age (~1450-1850 CE), however it is difficult to distinguish the impacts of recent anthropogenic climate warming on hurricane activity from those of natural Atlantic climate regimes, such as ENSO.”
“Since the late 1800s, in contrast to much of the Southeastern USA, the Georgia coast has experienced infrequent hurricane landfalls, particularly in recent decades. As a result, coastal storm preparedness complacency appears to be rampant along the Georgia coastline. Both local and state governments were unprepared for shadow evacuation during Hurricane Floyd in 1999. The study described here includes an examination of temporal and spatial trends in hurricane landfall along the Georgia coast from 1750 to 2012. Since 1750, 18 of the 24 recorded hurricanes that made landfall along the Georgia coast occurred between 1801 and 1900, yet the hurricane intensities have declined since 1851.”
No Increasing Trend In Drought/Flood Frequency, Severity
“In drought-prone regions like Central Asia, drought monitoring studies are paramount to provide valuable information for drought risk mitigation. In this paper, the spatiotemporal drought characteristics in Central Asia are analyzed from 1966 to 2015 using the Climatic Research Unit (CRU) dataset. Central Asia showed an overall wetting trend with a switch to drying trend since 2003.”
“The main objective of this paper is to detect the evidence of statistically significant flood trends across Europe using a high spatial resolution dataset. … Anticipated changes in flood frequency and magnitude due to enhanced greenhouse forcing are not generally evident at this time over large portions of the United States for several different measures of flood flows. … Thus, similarly to the main findings of Archfield et al. (2016) for the US, the picture of flood change in Europe is strongly heterogeneous and no general statements about uniform trends across the entire continent can be made.”
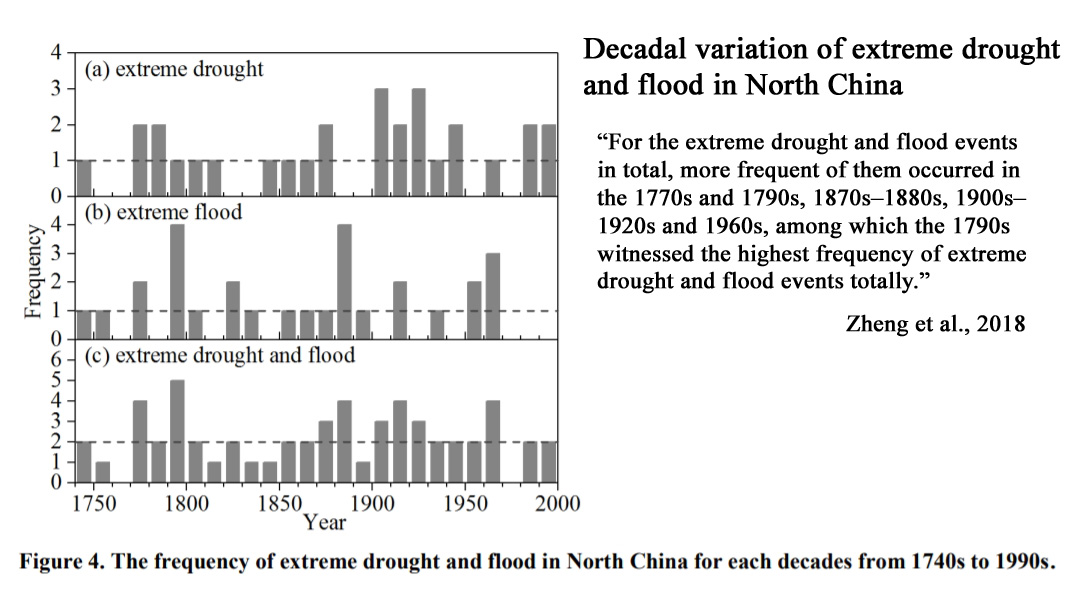
“For the extreme drought and flood events in total, more frequent of them occurred in the 1770s and 1790s, 1870s–1880s, 1900s–1920s and 1960s, among which the 1790s witnessed the highest frequency of extreme drought and flood events totally.”
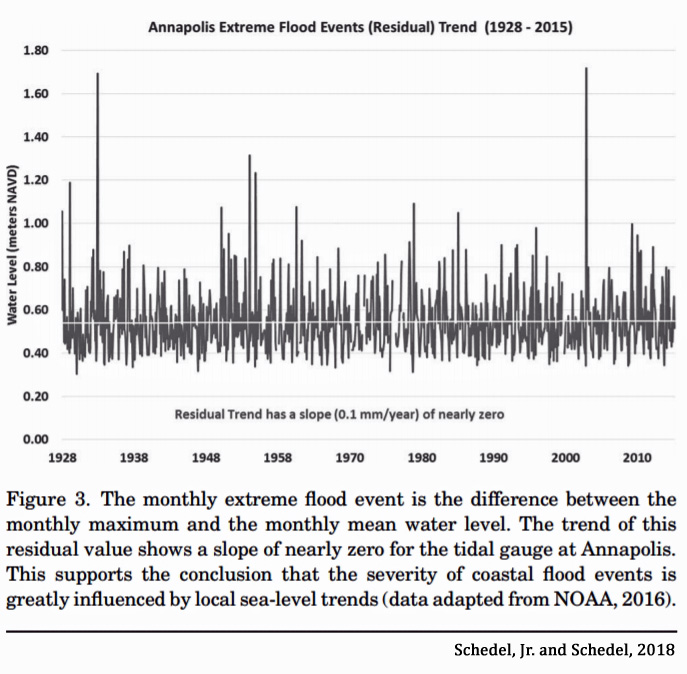
Schedel, Jr. and Schedel, 2018
“Flood events on the U.S. East Coast are not more severe or frequent than in the past. However, because of sea-level rise, these events are starting from a higher baseline height. Thus, the same severity of a flood event today reaches a greater absolute height than an identical flood would have reached 50 or 100 years ago.Based on current data, the good news is that the apparent worsening of flood events is due to a single, primary cause: sea level rise. Flood events are not getting stronger or occurring more frequently than in the past. They are instead starting from a higher point, allowing them to reach higher levels more often. The bad news is that sea-level rise will be a fact of life for many years into the future. Communities need to start now to make informed plans and decisions about how best to adapt.”
“This study presents a chronology of historical and measured flood events in the Papaloapan River basin of Mexico during 450 years. Twenty-eight historical floods were recorded during the period 1550–1948 [7 per century] on this river and one flood event (1969) in the instrumental era (1949–2000) [2 per century], of which 14 were extraordinary floods and only 15 were catastrophic ones. There were several flood-rich decades during 1860–1870, 1880–1890, 1920–1930 and 1940–1950. Wavelet analysis found a significant flooding periodicity of 58 years. The wavelet coherence analysis found that flooding had an in-phase relationship with the Atlantic Multidecadal Oscillation and also with the Pacific Decadal Oscillation.”
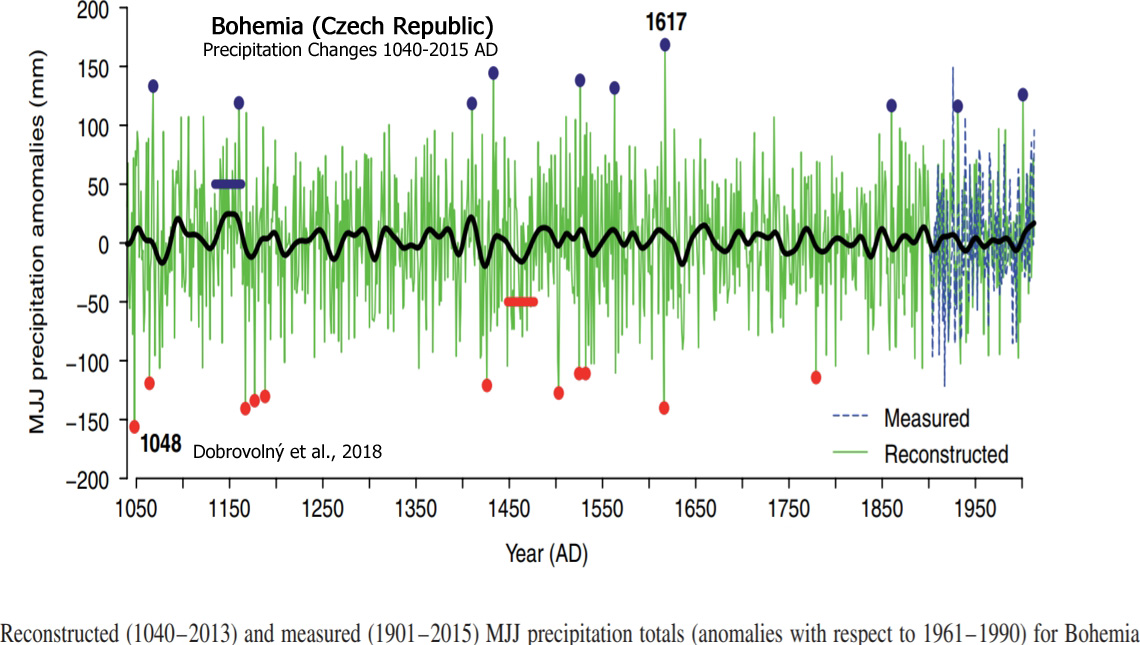
“The new MJJ precipitation reconstruction is restricted to inter-annual and inter-decadal variability, which is in line with our understanding of natural precipitation variability. Reconstruction reveals two long periods of low precipitation variability, in the 13th–14th centuries and 1630s–1850s. It also demonstrates that precipitation anomalies of larger amplitude and longer duration occurred in the earlier part of the last millennium than those found in the instrumental period. Negative trends in soil moisture content and gradual changes in annual precipitation distribution leading to higher extremity of precipitation regime may be responsible for the lower sensitivity of oaks to precipitation after the 1980s. The new reconstruction does not indicate any exceptional recent decline in MJJ precipitation.”
Extreme, Unstable Weather Decreases With Warming