http://www.thegwpf.com/global-ocean-temps-drop-back-to-pre-el-nino-levels/
GLOBAL OCEAN AIR TEMPS DROP BACK TO PRE-EL NINO LEVELS
Global ocean air temps are now the lowest since April 2015, and those in the Southern Hemisphere the lowest since May 2013.

Presently sea surface temperatures (SST) are the best available indicator of heat content gained or lost from earth’s climate system. Enthalpy is the thermodynamic term for total heat content in a system, and humidity differences in air parcels affect enthalpy. Measuring water temperature directly avoids distorted impressions from air measurements. In addition, ocean covers 71% of the planet surface and thus dominates surface temperature estimates. Eventually we will likely have reliable means of recording water temperatures at depth.
Recently, Dr. Ole Humlum reported from his research that air temperatures lag 2-3 months behind changes in SST. He also observed that changes in CO2 atmospheric concentrations lag behind SST by 11-12 months. This latter point is addressed in a previous post Who to Blame for Rising CO2?
The May update to HadSST3 will appear later this month, but in the meantime we can look at lower troposphere temperatures (TLT) from UAHv6 which are already posted for May. The temperature record is derived from microwave sounding units (MSU) on board satellites like the one pictured above.
The UAH dataset includes temperature results for air above the oceans, and thus should be most comparable to the SSTs. The graph below shows monthly anomalies for ocean temps since January 2015.

The anomalies have reached the same levels as 2015. Taking a longer view, we can look at the record since 1995, that year being an ENSO neutral year and thus a reasonable starting point for considering the past two decades. On that basis we can see the plateau in ocean temps is persisting. Since last October all oceans have cooled, with upward bumps in Feb. 2018, now erased.
| UAHv6 TLT Monthly Ocean Anomalies |
Average Since 1995 | Ocean 5/2018 |
| Global | 0.13 | 0.09 |
| NH | 0.16 | 0.33 |
| SH | 0.11 | -0.09 |
| Tropics | 0.12 | 0.02 |
As of May 2018, global ocean temps are slightly lower than April and below the average since 1995. NH remains higher, but not enough to offset much lower temps in SH and Tropics (between 20N and 20S latitudes). Global ocean air temps are now the lowest since April 2015, and SH the lowest since May 2013.
The details of UAH ocean temps are provided below. The monthly data make for a noisy picture, but seasonal fluxes between January and July are important.
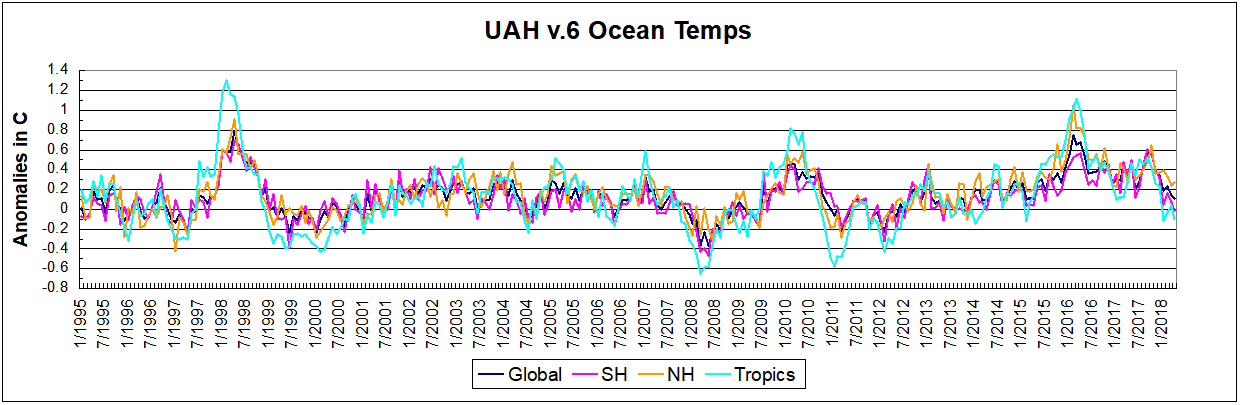
Click on image to enlarge.
The greater volatility of the Tropics is evident, leading the oceans through three major El Nino events during this period. Note also the flat period between 7/1999 and 7/2009. The 2010 El Nino was erased by La Nina in 2011 and 2012. Then the record shows a fairly steady rise peaking in 2016, with strong support from warmer NH anomalies, before returning to the 22-year average.