A Disgraceful Chasm Between Real-World
Observations & Climate Science Reporting

Injecting frightening scenarios into climate science reporting has seemingly become a requisite for publication.
In a new Nature Geoscience editorial, a common scare tactic is utilized by the (unidentified) author so as to grab readers’ attention.
Nature Geoscience, 2018
The East Antarctic ice sheet is currently the largest ice mass on Earth. If it melted in its entirety, global sea levels would rise by more than 50 metres.
Wow. 50 meters. That would be catastrophic.
But then we read about real-world observations for East Antarctica. And they don’t even come close to aligning with the catastrophic scenario casually tossed into the editorial.
First of all, East Antarctica is not losing mass and adding to sea levels. The ice sheet is gaining mass and thus removing water from sea levels. The surface mass gains have been occurring not only since 1800 (Thomas et al., 2017), but for the recent decade (2003-2013) too (Martín-Español et al., 2017). Even the author of the Nature Geoscience editorial acknowledges this.
Nature Geoscience, 2018
The East Antarctic ice sheet may be gaining mass in the current, warming climate. The palaeoclimate record shows, however, that it has retreated during previous episodes of prolonged warmth.
Not only has East Antarctica been gaining mass, the author goes on to say that it would take 100s of thousands to millions of years for Antarctica to even exhibit partial retreat. So much for the “if it melted in its entirety” warning we read earlier.
In terms of immediate sea-level rise, it is reassuring that it seems to require prolonged periods of lasting hundreds of thousands to millions of years to induce even partial retreat.
So if the editorial department at Nature Geoscience realizes that it would take 100s of thousands to millions of years to even witness a partial retreat of the ice sheet, is there any scientific justification for the inclusion of the sea-levels-would-rise-50-meters-if-East-Antarctica-melted commentary? Since when do imaginary scenarios pass as science?
A ‘Staggering’ 9 Trillion Tons Of Greenland’s Ice Has Been Lost Since 1900! That’s A Sea Level Contribution Of Less Than 1 Inch
It’s frightening to learn that the Greenland Ice Sheet has lost a “staggering” 9 trillion tons of ice since 1900, which is what the Washington Post warned us about in 2015.
It’s not frightening to learn that 9 trillion tons of ice losses actually amounts to less than 1 inch of sea level rise contribution from Greenland meltwater in 115 years.
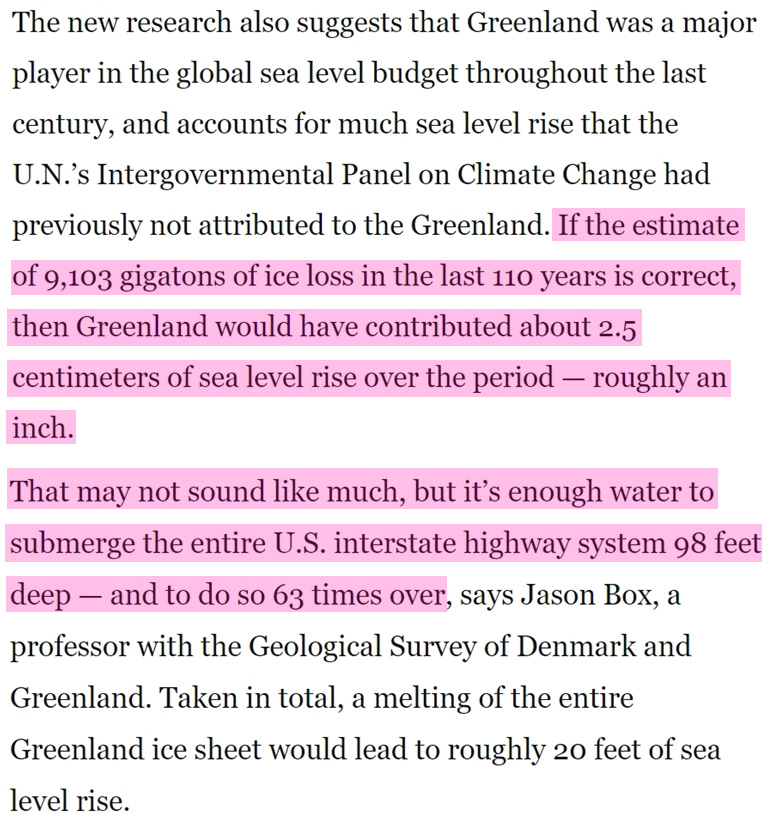
Since a total sea level rise contribution of 1 inch in 115 years from the Greenland ice sheet isn’t scary, the author of the Washington Post article (Chris Mooney) finds it necessary to offer his readers a macabre thought experiment: What if that additional 1 inch of water sitting atop the world ocean were to be collected somehow and then dumped onto all the United States interstate highways? Now that would be scary. It would mean that 1 inch of sea level rise turned into 98 feet of sea levels rise (63 times over) in very same imaginary world where additional sea water is dumped onto U.S. interstate highways.
This is how the modern version of climate science works.
Below are a few more examples of glacier melt and sea level rise observations from recently-published papers casting doubt on the tragic, alarmist, and attention-seeking headlines that are so prevalent today.
1. ‘Pine Island Glacier Is The Largest Current Antarctic Contributor To Sea Level Rise’ – But Has ‘Not Shown Any Clear Trend Over 68 Years’ (1947-2015)
Arndt et al., 2018
Pine Island Glacier is the largest current Antarctic contributor to sea level rise. Its ice loss has substantially increased over the last 25 years through thinning, acceleration and grounding line retreat. However, the calving line positions of the stabilizing ice shelf did not show any trend within the observational record (last 70 years) until calving in 2015 led to unprecedented retreat and changed alignment of the calving front. … Despite the thinning and flow acceleration of PIG [Pine Island Glacier], and sustained, rapid thinning of the ice shelf over at least the past 25 years the position of the ice front had not shown any clear trend over 68 years of observations prior to 2015 (Bindschadler, 2002;MacGregor et al., 2012;Rignot, 2002).
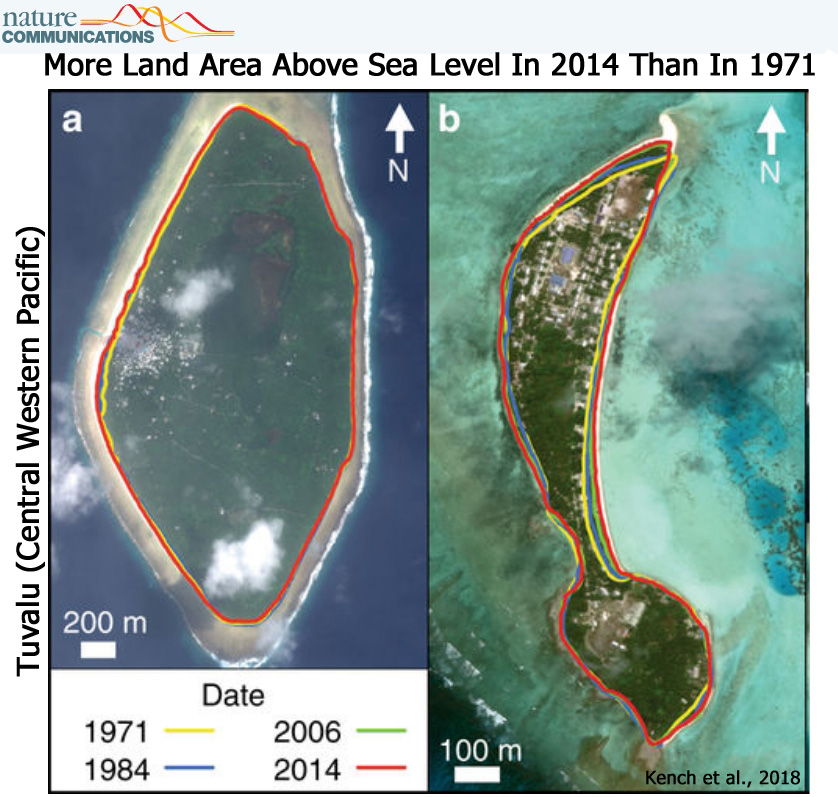
2. More Land Area Above Sea Level In 2014 Than In 1971 In The Tropical Pacific
Kench et al., 2018
We specifically examine spatial differences in island behaviour, of all 101 islands in Tuvalu, over the past four decades (1971–2014), a period in which local sea level has risen at twice the global average (Supplementary Note 2). Surprisingly, we show that all islands have changed and that the dominant mode of change has been island expansion, which has increased the land area of the nation. … Using remotely sensed data, change is analysed over the past four decades, a period when local sea level has risen at twice the global average [<2 mm/yr-1] (~3.90 ± 0.4 mm.yr−1). Results highlight a net increase in land area in Tuvalu of 73.5 ha (2.9%), despite sea-level rise, and land area increase in eight of nine atolls.
3. More Land Area Above Sea Level In 2015 Than In 1985 For The Entire Globe
Donchyts et al., 2016
Earth’s surface water change over the past 30 years [1985-2015] … Earth’s surface gained 115,000 km2 of water and 173,000 km2 of land over the past 30 years, including 20,135 km2 of water and 33,700 km2 of land in coastal areas.
(press release)
Coastal areas were also analysed, and to the scientists’ surprise, coastlines had gained more land – 33,700 sq km (13,000 sq miles) – than they had been lost to water (20,100 sq km or 7,800 sq miles).
“We expected that the coast would start to retreat due to sea level rise, but the most surprising thing is that the coasts are growing all over the world,” said Dr Baart. “We were able to create more land than sea level rise was taking.”
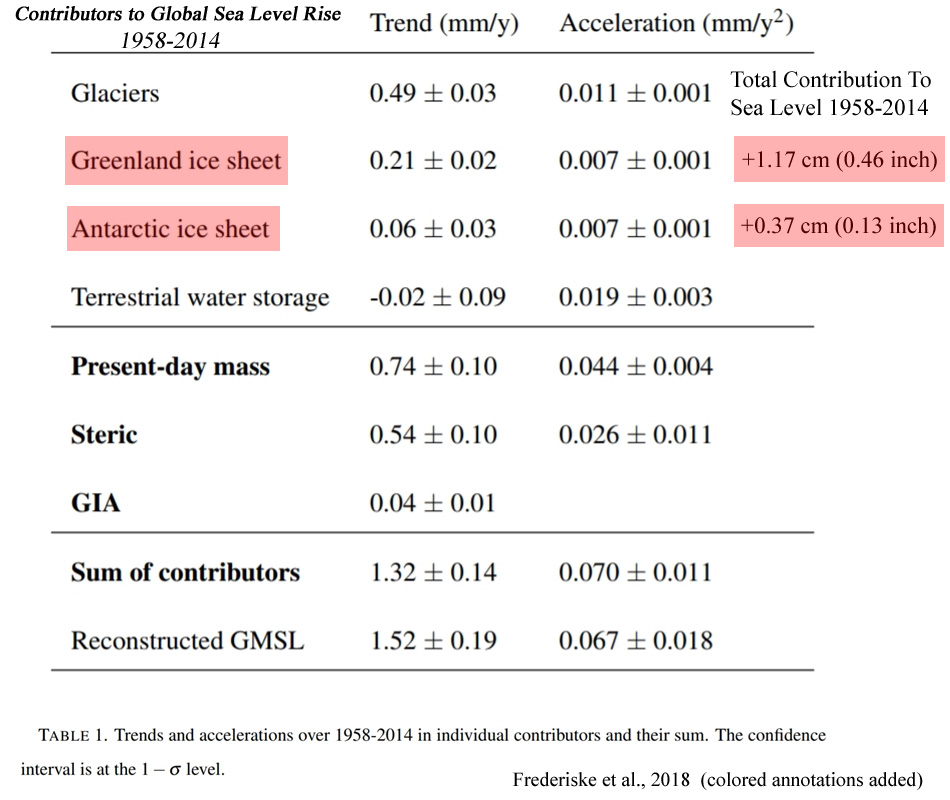
4. Greenland And Antarctica Combined Contributed A Total Of 0.59 Of An Inch To Sea Level Rise Between 1958-2014
Frederiske et al.,2018