
https://www.carbonbrief.org/major-correction-to-satellite-data-shows-140-faster-warming-since-1998
A new paper published in the Journal of Climate reveals that the lower part of the Earth’s atmosphere has warmed much faster since 1979 than scientists relying on satellite data had previously thought.
Researchers from Remote Sensing Systems (RSS), based in California, have released a substantially revised version of their lower tropospheric temperature record.
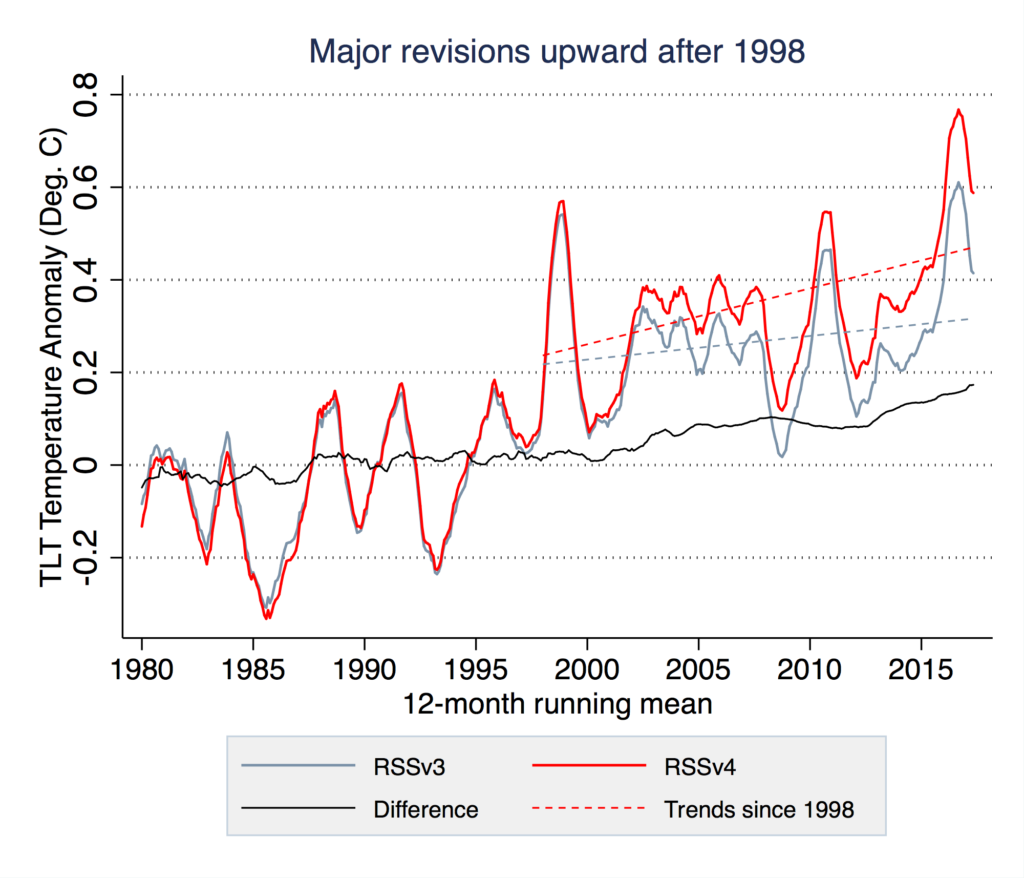
After correcting for problems caused by the decaying orbit of satellites, as well as other factors, they have produced a new record showing 36% faster warming since 1979 and nearly 140% faster (i.e. 2.4 times larger) warming since 1998. This is in comparison to the previous version 3 of the lower tropospheric temperature (TLT) data published in 2009.
Climate sceptics have long claimed that satellite data shows global warming to be less pronounced than observational data collected on the Earth’s surface. This new correction to the RSS data substantially undermines that argument. The new data actually shows more warming than has been observed on the surface, though still slightly less than projected in most climate models.
Produced by Carbon Brief using data from RSS.
Both the old record, version 3 in grey, and new record, version 4 in red, are shown in the figure above, along with the difference between the two, in black. The trends since 1998 for both are shown by dashed lines.
Most of the difference between the old and new record occurs after the year 2000. While the old record showed relatively little warming during the oft-debated post-1998 “hiatus” period, the new record shows warming continuing unabated through to present. Similarly, while the old RSS v3 record showed 2016 only barely edging out 1998 as the warmest year in the satellite record, the new v4 record shows 2016 as exceeding 1998 by a large margin.
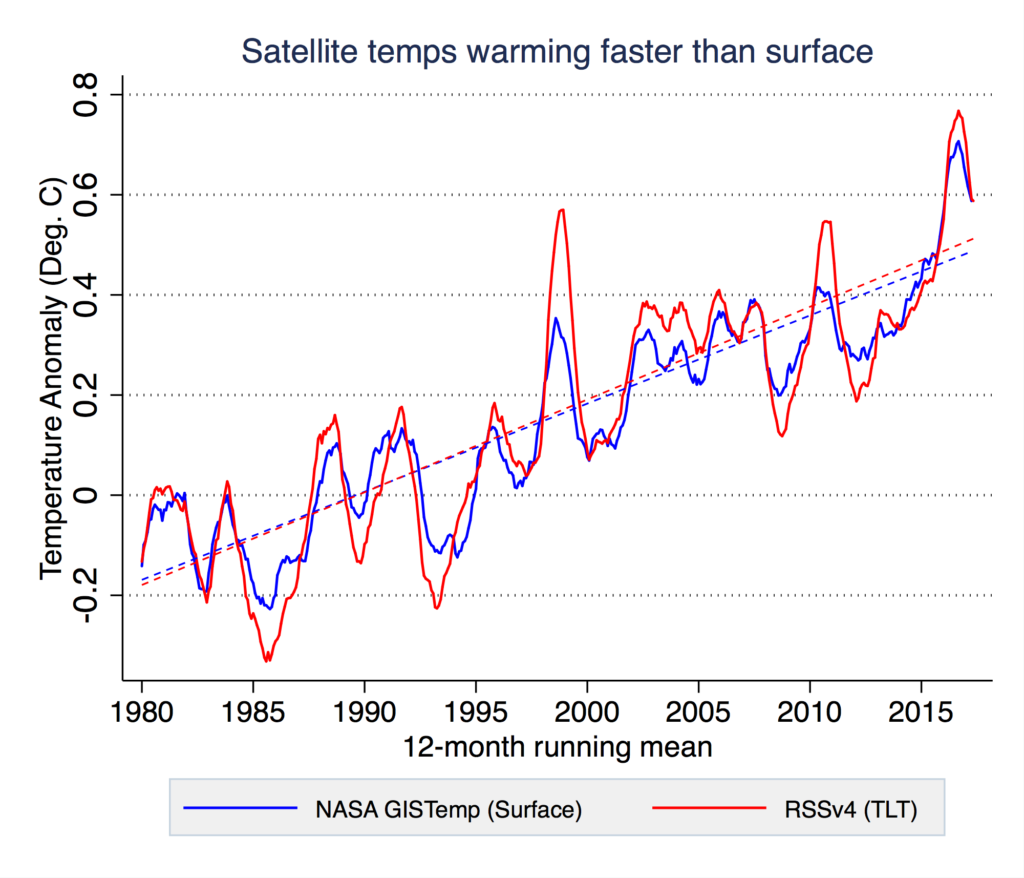
The figure above shows a comparison between the new RSS record and the global surface temperature record produced by NASA. RSS v4 shows about 5% more warming than the NASA record since 1979, when satellite observations began.
Challenge of satellite-based temperatures
Satellites have been used to measure the temperature of the Earth’s atmosphere since the late 1970s. While the first global temperature records from satellites were assembled in the early 1990s, they have gone through multiple major revisions over the years, as researchers discovered and corrected various issues in the dataset caused by changing satellites, instrument types and flyover times.
A total of 15 different satellites have been used to measure atmospheric temperatures since 1979, with around two satellites actively measuring at any given time. Two different groups, Remote Sensing Systems (RSS) and the University of Alabama Huntsville (UAH) produce global TLT records that are widely used, with RSS originally developing their record in response to issues they identified in the UAH group’s work.
As these satellites circle the Earth, their orbits slowly decay over time due to drag from the upper atmosphere. While the satellites are designed to fly over the same spot on the Earth at the same time every day – a precondition to accurately estimating changes in temperatures over time – this orbital decay causes their flyover time to change. The figure below shows the local time that each different satellite flies over the equator and how they have changed over the lifetime of the satellite.

