Since 2014, 400 Scientific Papers
Affirm A Strong Sun-Climate Link
2017 – 80 Scientific Papers Linking Solar Forcing To Climate
2016 – 133 Scientific Papers Linking Solar Forcing To Climate
2015 – 95 Scientific Papers Linking Solar Forcing To Climate
2014 – 93 Scientific Papers Linking Solar Forcing To Climate
The 20 Latest Sun-Climate Papers
“We confirm the occurrence of upcoming Modern grand minimum in 2020-2053 … [and] extremely incorrect prediction of the terrestrial temperature growth in the next century.” – Zharkova et al., 2017
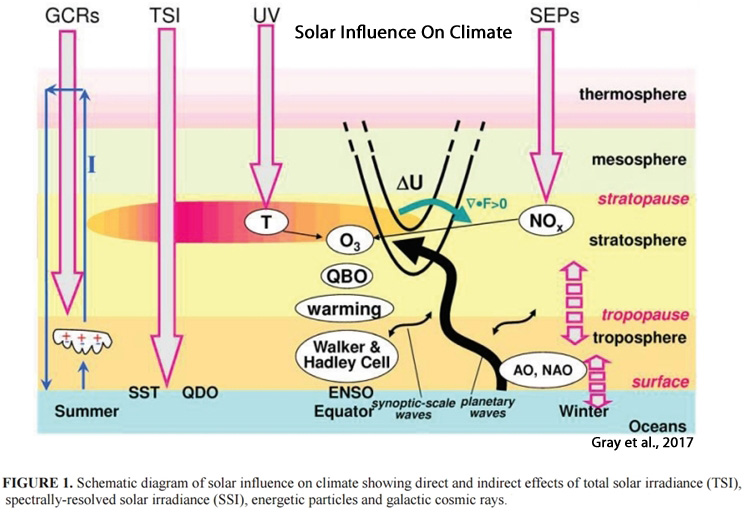
1. Gray et al., 2017 “There are several proposed mechanisms through which the 11-year solar cycle (SC) could influence the Earth’s climate, as summarised by Figure 1. These include: (a) the direct impact of solar irradiance variability on temperatures at the Earth’s surface, characterised by variation in the total incoming solar irradiance (TSI); (b) the indirect impact of variations through the absorption of Ultra-Violet (UV) radiation in the upper stratosphere associated with the presence of ozone, with accompanying dynamical responses that extend the impact to the Earth’s surface; (c) the indirect impact of variations in energetic particle fluxes into the thermosphere, mesosphere and upper stratosphere at high geomagnetic latitudes; and (d) the impact of variations in the generation of ions by galactic cosmic ray (GCR) penetration into the troposphere. Although different in their nature, these four pathways may not work in isolation but their influence could be synergetic.”
2. Zharkova et al., 2017 “Using a summary curve of two eigen vectors of solar magnetic field oscillations derived with Principal Components Analysis (PCA) from synoptic maps for solar cycles 21-24 as a proxy of solar activity, we extrapolate this curve backwards three millennia revealing 9 grand cycles lasting 350-400 years each. The summary curve shows a remarkable resemblance to the past sunspot and terrestrial activity: grand minima – Maunder Minimum (1645-1715 AD), Wolf minimum (1280-1350 AD), Oort minimum (1010-1050 AD) and Homer minimum (800 900 BC); grand maxima – modern warm period (1990-2015), medieval warm period (900-1200 AD), Roman warm period (400-10 BC) and others. We verify the extrapolated activity curve by the pre-telescope observations of large sunspots with naked eye, by comparing the observed and simulated butterfly diagrams for Maunder Minimum (MM), by a maximum of the terrestrial temperature and extremely intense terrestrial auroras seen in the past grand cycle occurred in 14-16 centuries.”
“We confirm the occurrence of upcoming Modern grand minimum in 2020-2053, which will have a shorter duration (3 cycles) and, thus, higher solar activity compared to MM [Maunder Minimum]. … One of the examples of fitting incorrectly the oscillating function with a linear regression approach is shown by Akasofu (2010) (see her Fig. 9), when explaining the modern era recovery of the Earth from the little ice period and the incorrect use of a linear part of the temperature variations for the extremely incorrect prediction of the terrestrial temperature growth in the next century.”
3. Harde, 2017 “[A] naturally generated [CO2 emission] contributes more than 95% to the overall emission, and its generation rate and the respective absorption rate sensitively respond on global temperature variations. … [The] well known delayed response of CO2 and methane (CH4) to sea and air temperature changes (see, e.g., Petit et al. [2]; Monnin et al. [3]; Caillon et al. [4]; Torn and Harte [5]; Humlum et al. [6]; Salby [7]) are not considered in AR5. … As long as any natural variations in the CO2 concentrations are not accurately known, the ECS [equilibrium climate sensitivity to CO2 doubling] cannot be used as a reliable indicator only for an anthropogenic global warming.”
“The IPCC denies any noticeable solar influence on the actual climate, although strong evidence of an increasing solar activity over the last century exists (see, e.g., Hoyt & Schatten [8]; Willson & Mordvinov [9]; Shapiro et al. [10]; Ziskin & Shaviv [11]; Scafetta & Willson [12]; Usoskin et al. [13]; Zhao & Feng [14]; Soon et al. [15]). … From these studies we conclude that the measured temperature increase of 0.74∘ C over the time 1880–2000 and the observed cloud changes of −4% over the period 1983– 2000 can best be explained by a cloud feedback mechanism, which is dominated by the solar influence. Therefore, it seems quite reasonable to use a model mean of [climate sensitivity to doubled CO2] = 0.7°C, yielding a CO2 initiated warming of 0.3°C [1880-2000] and a solar contribution of 0.44°C [1880-2000].”
– See more at: http://notrickszone.com/2017/06/12/20-more-new-papers-link-solar-forcing-to-climate-change-now-80-sun-climate-papers-for-2017/#sthash.hBaOxS6t.dpuf