
By Dr. Judith Curry, former Chair of the School of Earth and Atmospheric Sciences at the Georgia Institute of Technology
Via: http://judithcurry.com/2014/12/09/spinning-the-warmest-year
Spinning the ‘warmest year’
by Judith Curry
The buzz is intensifying about 2014 possibly being the warmest year globally in the historical temperature record.
The spin
The World Meteorological Organization (WMO) issued a Press Release on 3 Dec:2014 on course to be one of the hottest, possibly hottest, on record. Excerpts:
WMO’s provisional statement on the Status of the Global Climate in 2014indicated that the global average air temperature over land and sea surface for January to October was about 0.57° Centigrade (1.03 Fahrenheit) above the average of 14.00°C (57.2 °F) for the 1961-1990 reference period, and 0.09°C (0.16 °F) above the average for the past ten years (2004-2013).
If November and December maintain the same tendency, then 2014 will likely be the hottest on record, ahead of 2010, 2005 and 1998. This confirms the underlying long-term warming trend. It is important to note that differences in the rankings of the warmest years are a matter of only a few hundredths of a degree, and that different data sets show slightly different rankings.
“The provisional information for 2014 means that fourteen of the fifteen warmest years on record have all occurred in the 21st century,” said WMO Secretary-General Michel Jarraud. “There is no standstill in global warming,” he said.
“What we saw in 2014 is consistent with what we expect from a changing climate. Record-breaking heat combined with torrential rainfall and floods destroyed livelihoods and ruined lives. What is particularly unusual and alarming this year are the high temperatures of vast areas of the ocean surface, including in the northern hemisphere,” he said.
“Record-high greenhouse gas emissions and associated atmospheric concentrations are committing the planet to a much more uncertain and inhospitable future. WMO and its Members will continue to improve forecasts and services to help people cope with more frequent and damaging extreme weather and climate conditions,” said Mr Jarraud.
The provisional statement was published to inform the annual climate change negotiations taking place in Lima, Peru. WMO also updated its acclaimed Weather Reports for the Future series, with scenarios for the weather in 2050 based on the Fifth Assessment report from the Intergovernmental Panel for Climate Change, which is co-sponsored by WMO and the UNEP. Newly added reports are for Peru, France, Viet Nam, Spain, Canada and Norway, painting a compelling picture of what life could be like on a warmer planet.
Matt Ridley has a subsequent article in The Times: Beware the corruption of science. Subtitle: Environmental researchers are increasingly looking for evidence that fits their ideology rather than seeking the truth. Excerpts (from the GWPF article):
Second example: last week, the World Meteorological Organization (WMO), a supposedly scientific body, issued a press release stating that this is likely to be the warmest year in a century or more, based on surface temperatures. Yet this predicted record would be only one hundredth of a degree above 2010 and two hundredths of a degree above 2005 — with an error range of one tenth of a degree. True scientists would have said: this year is unlikely to be significantly warmer than 2010 or 2005 and left it at that.
In any case, the year is not over, so why the announcement now? Oh yes, there’s a political climate summit in Lima this week. The scientists of WMO allowed themselves to be used politically. Not that they were reluctant. To squeeze and cajole the data until they just crossed the line, the WMO “reanalysed” a merger of five data sets. Maybe that was legitimate but, given how the institutions that gather temperature data have twice this year been caught red-handed making poorly justified adjustments to “homogenise” and “in-fill” thermometer records in such a way as to cool down old records and warm up new ones, I have my doubts.
Most of the people in charge of collating temperature data are vocal in their views on climate policy, which hardly reassures the rest of us that they leave those prejudices at the laboratory door. Imagine if bankers were in charge of measuring inflation.
Typically, Michael Mann responds to Ridley’s article with this tweet:
Michael E. Mann: Latest #climatescience smearer @mattwridley has a disturbing record of disinformation & denial. Via @SourceWatch:http://www.sourcewatch.org/index.php?title=Matt_Ridley
Data and uncertainty
Last week, I received the following query from a reporter:
I’m covering the release of the WMO’s provisional climate statement for 2014. It says 2014 is on track to become one of the hottest, if not the hottest, years on record. A lot of people here at the UN climate talks in Lima say this shows there is no slowdown in warming. What is your take?
My response:
We won’t really have a good assessment on the temperatures for 2014 until about March 2015, when all of the observations have been assembled and quality controlled. The different temperature datasets and analyses give different results, which reflects the uncertainties in the data and analysis methods. Even if one or several data sets do find 2014 to be the hottest year, given the uncertainties one can only conclude that this is one of the top 5 or so warmest years.
The real issue that is of concern to me is the growing divergence between the the observed global temperature anomalies and what was predicted by climate models. Even if 2014 is somehow unambiguously the warmest year on record, this won’t do much to alleviate the growing discrepancy between climate model predictions and the observations.
If it does turn out to be the hottest does that indicate the pause is over?
One year won’t really make a difference, unless it is extremely warm. And then 2015 would need to be even warmer than 2014. So declaring the pause to be ‘over’ will require continued warming. Again, the pause itself is not of such great significance; rather it is the growing divergence between climate model predictions and the observations – one warm year isn’t going to really change this.
—-
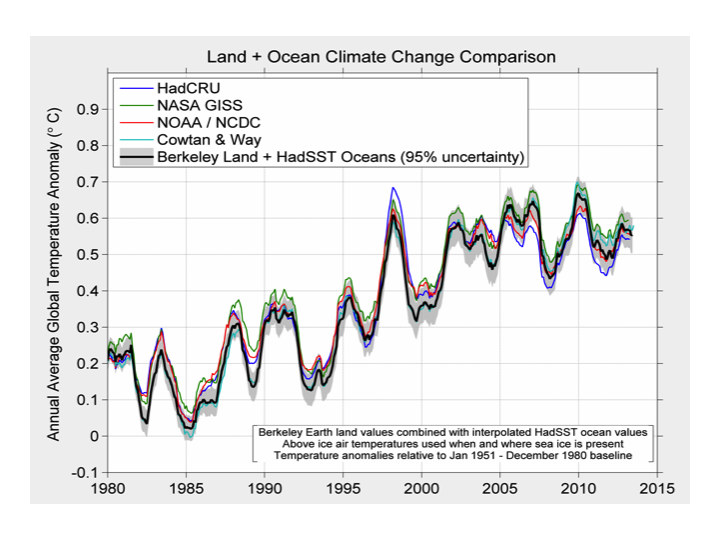
The differences among the different global surface temperature analyses are illustrated by this figure that Steve Mosher provided for my recent Senate testimony:
 From the main text of the WMO report:
Global average temperatures are also estimated using reanalysis systems, which use a weather forecasting system to combine many sources of data to provide a more complete picture of global temperatures. According to data from the reanalysis produced by the European Centre for Medium-Range Weather Forecasts, the January to October combined land and ocean global average temperature would place 2014 as third or fourth highest for this dataset, which runs from 1958. Based on these lines of evidence it is most likely that 2014 is currently one of the four warmest years on record, but there is a possibility that the final rank will lie outside this range.
The reanalysis systems have been underutilized for estimated temperature trends, warmest years, etc. Because of changes to observing systems, the reanalyses have generally not been used for trend analyses. However, particularly for examining recent trends (e.g. the pause), I would say that the observing systems have arguably been sufficiently homogeneous since 1989 for this purpose. The great advantage of using the reanalyses is that ‘infilling’ for regions without observations is accomplished through data assimilation using a numeral weather prediction system (for details, see previous CE postreanalyses.org). This ‘infilling’ is done in a dynamically consistent way, which IMO is much better than the various statistical infilling or kriging strategies.
With regards to ‘warmest year’, Gavin Schmidt tweeted an interesting graph that illustrates record warmth estimates, although it is not clear what constitutes the distributions. In any event, it is seen that 2014 has a similar distribution to 1998, 2005, 2010. With this visualization, it is seen that 1998 clearly stood out as ‘warmest year’ at the time.

Implications for the pause
Well, ranking 1998, 2005, 2010 and 2014 as the ‘warmest years’ seems very consistent with a plateau in surface temperatures since 1998. Even if 2014 maintains its status among the top 4, how does this impact the ‘pause’ narrative?
RealClimate, Tamino, and probably others are busy trying to convince that the pause doesn’t exist. The preferred data set for such analyses is Cowtan and Way; I am not a fan of this dataset owing to concerns about how they treat the Arctic [link]. Statistical games can be played, and you can infer that there is a pause (or not).
The real issue is the growing divergence between climate model projections and the surface temperature observations, illustrated in this diagram by Ed Hawkins:
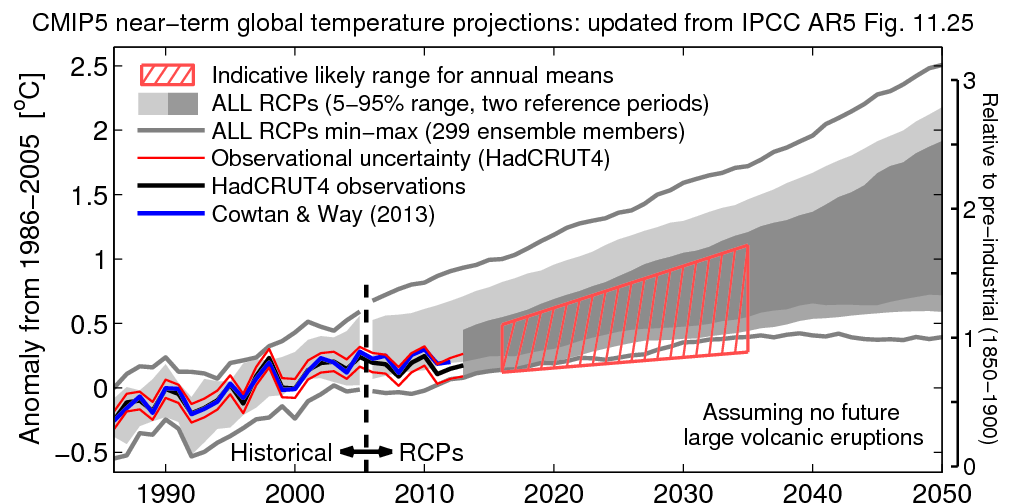
You can see that using the Cowtan and Way data set doesn’t help much with regards to the discrepancy: Cowtan and Way is within the error bars of HadCRUT4.
Updating this diagram to include 2014 is going to increase the discrepancy between the models and observations, because the climate models show an inexorable warming.
Judith Curry summary
Focusing on the ‘warmest year’ is a pointless exercise, unless the warm anomaly is as large as 1998. Focusing on the ‘pause’ is mainly significant in context of the comparison between climate model projections and surface temperatures.
Attempts to spin 2014 as a possible ‘warmest year’ is exactly that: spin designed to influence the Lima deliberations. While the WMO report was not unreasonable, their press release was a clear attempt to influence the Lima deliberations in the direction of being ‘alarmed.’
I’ll be waiting until HadCRUT and Berkeley Earth have provided their final 2014 temperature analyses (which will probably be sometime late winter). Particularly with regards to the recent temperature record and the ‘pause’, I think more scrutiny should be given to the various reanalyses, which in principle is probably the best way to provide a truly global analysis.

