The Sun in April 2019
By Prof. Fritz Vahrenholt and Frank Bosse
(German text translated/edited by P. Gosselin)
If we speak of an average of the last 23 cycles in the months of the minimum, our only significant energy source at the center of the solar system was below average active last month as well.
The sunspot number (SSN) was 9.1, which was thus only 42% of the average of the cycles for month no. 125. Some cycles (No. 21, 18, 16, 15, 8 ) were already completed in month no. 125.

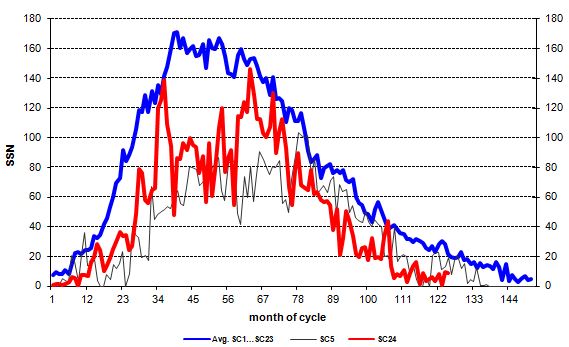
Fig. 1: The monthly sunspot activity of the current solar cycle (SC 24) since December 2008 (red) compared to the mean value of all previously systematically observed cycles since the beginning of SC 1 in March 1755 (blue) and the very similar SC 5 (black).
Figure 1 clearly shows that the latest cycle was quite below-normal, especially at the beginning and after the second peak which had an SSN of over 140 towards the end. Since February 2014 (the maximum of the entire cycle 24 with SSN = 146 in cycle month 63), it only reached 2/3 of the average activity.
What are the effects? The total radiation (TSI for total solar irradiance) is only moderately influenced:

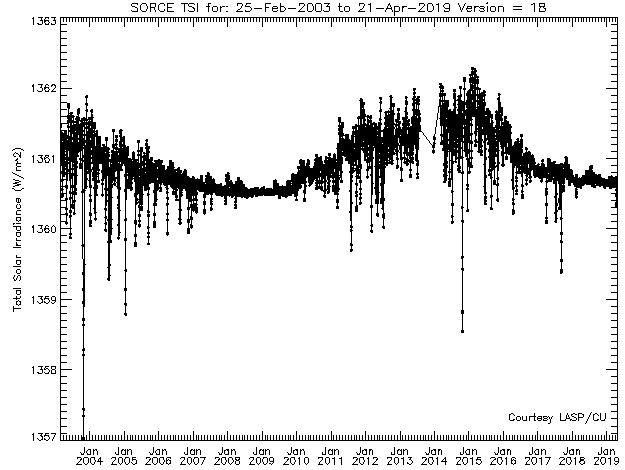
Fig. 2: The total solar irradiance at the Earth’s distance since the end of 2003, when probe’s mission began. Source.
Since the maximum, we have seen a decrease of about 1.5 W/m². On the ground this drop decreases to 25% because the earth is not perpendicular to the sun (like the satellite’s sensor) and it rotates. This leaves only a boost of 0.38W/m² in effective radiant power, or 0.1%, which is comparatively little.
Another magnitude may have more influence: During high activity, the sun keeps the galactic cosmic radiation (actually less electromagnetic radiation, but more particles) away from the interior of the solar system. It performs this shielding less effectively with reduced solar activity.

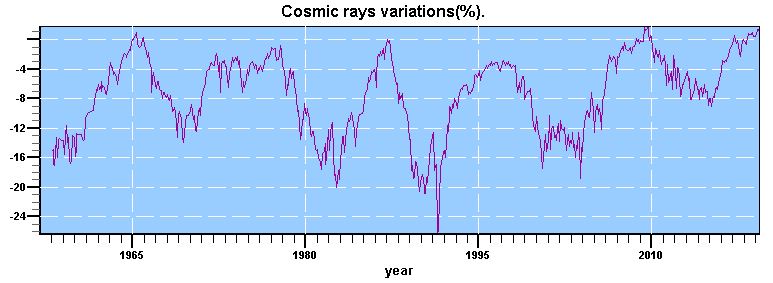
Fig. 3: Galactic radiation since the 1960s. The series has been measured in Moscow.Source. Note: Upper peaks show strong cosmic radiation.
Since the beginning of the 2000s, a decrease of up to 16% compared to the 90s can currently be seen. Also in the maximum of SC24 around 2014 cosmic rays were about 8% stronger than in the maxima since 1980.
We had reported about the connections, which Hendrik Svensmark postulates, in the book and also in the blog (last here) several times.
Next we look at the comparison of the cycles among each other:

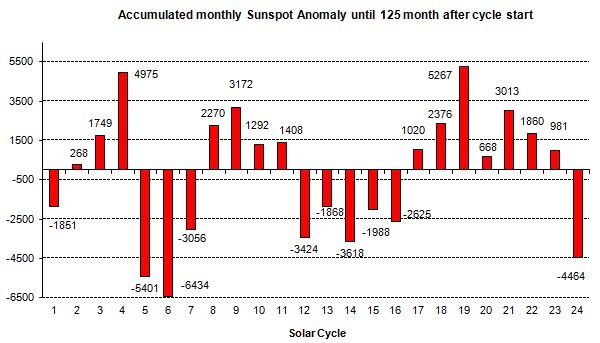
Fig. 4: The sunspot activity of the cycles in comparison. The numbers in the diagram are obtained by summing the monthly differences between the observed SSN and the mean (blue in Fig.1) up to the current cycle month 125.
Also the coming cycle 25 – with a probable start in August 2020 (here we showed how we came to this view) – will again be below average with a high degree of certainty. The peak phase of solar activity from 1935 to about 2005 (SC 17…SC23) is over.


