
Modern Climate Warming Is Not
Dangerous, Unprecedented, Globally Pervasive
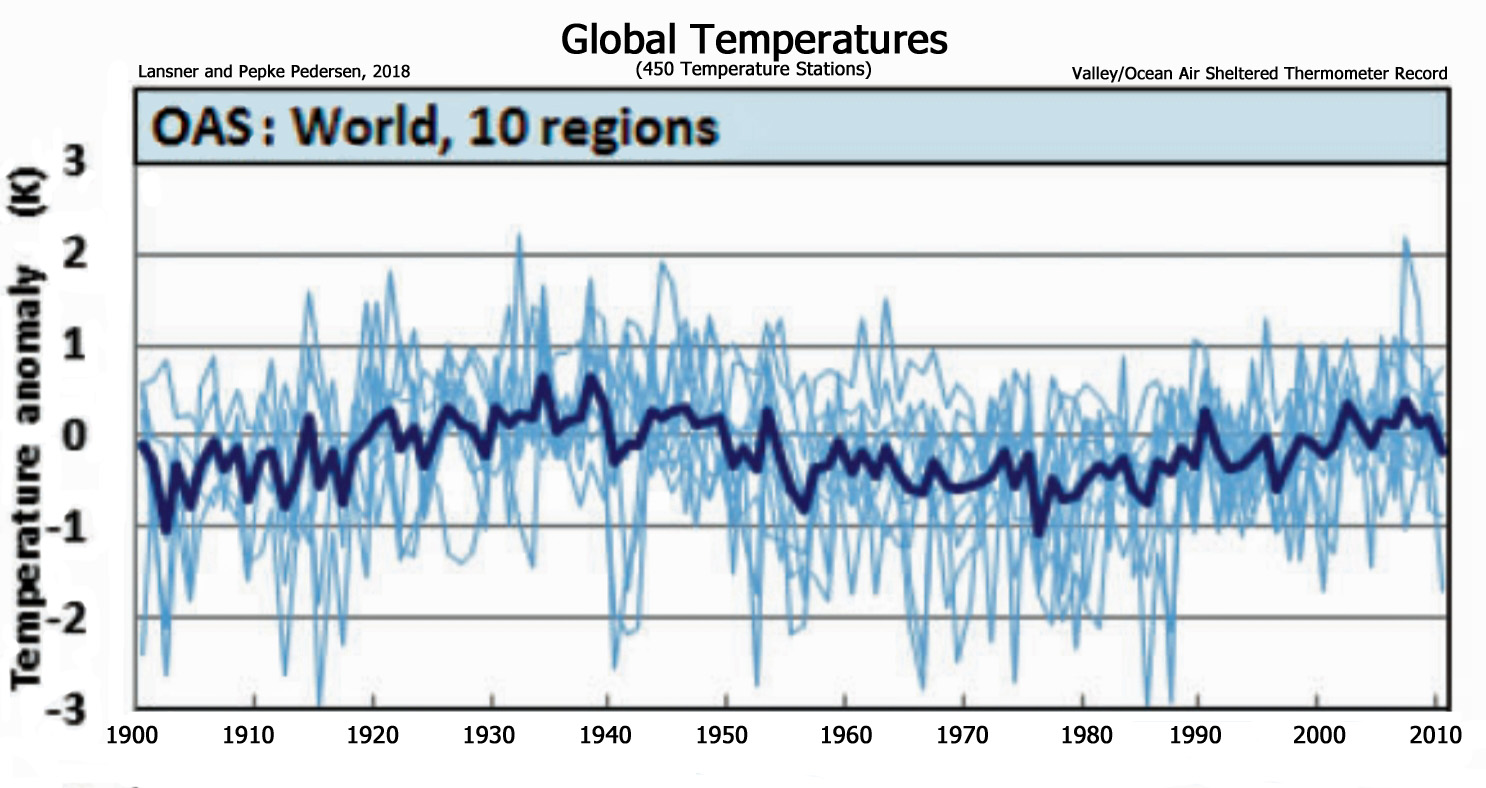
Image Source: Lansner and Pepke Pedersen, 2018
By Kenneth Richard
The Hockey Stick Fails
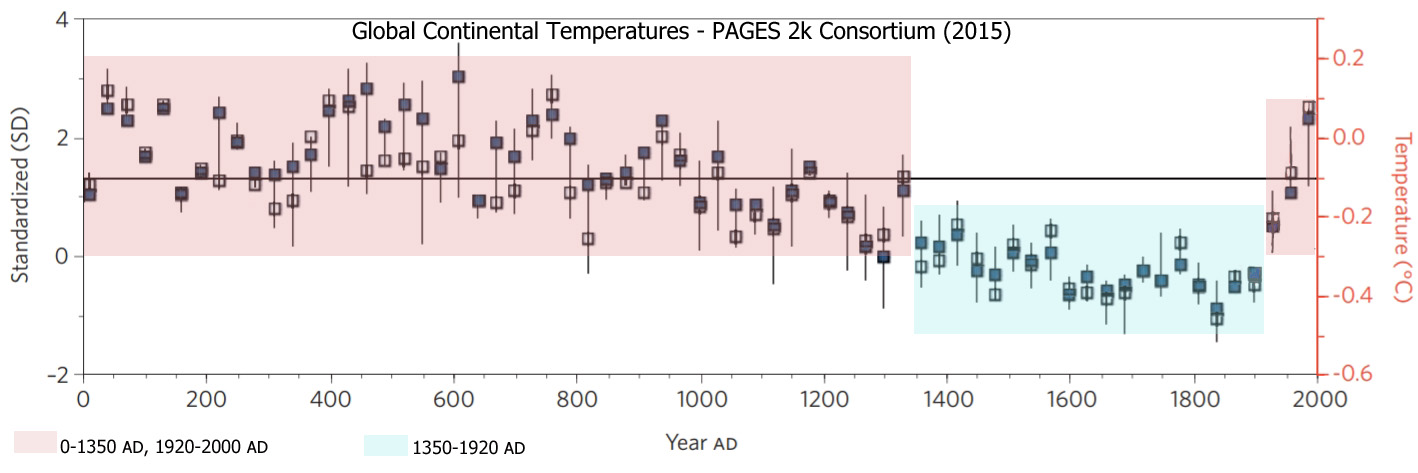
The PAGES 2k Consortium (2013) attempted to compile an unprecedented-looking hockey-stick-shaped Holocene reconstruction. Instead, it has withered under scrutiny.
Analysis of the PAGES 2k data clearly shows that 20th century warmth is merely a partial return to the normal temperatures that characterized most of the Late Holocene. The only aspect of the last two millennia that is climatically anomalous may be the centuries of Little Ice Age cooling.
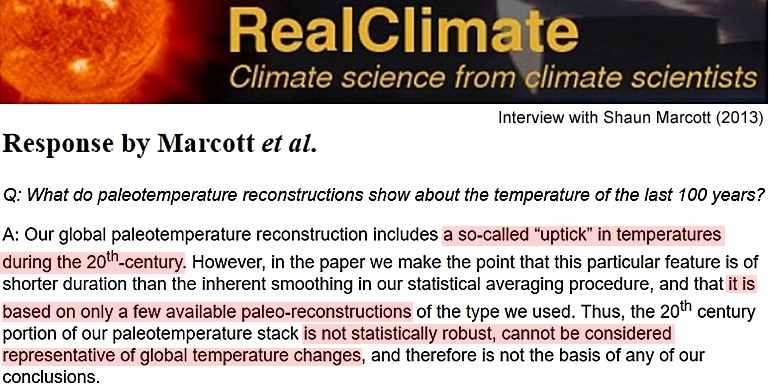
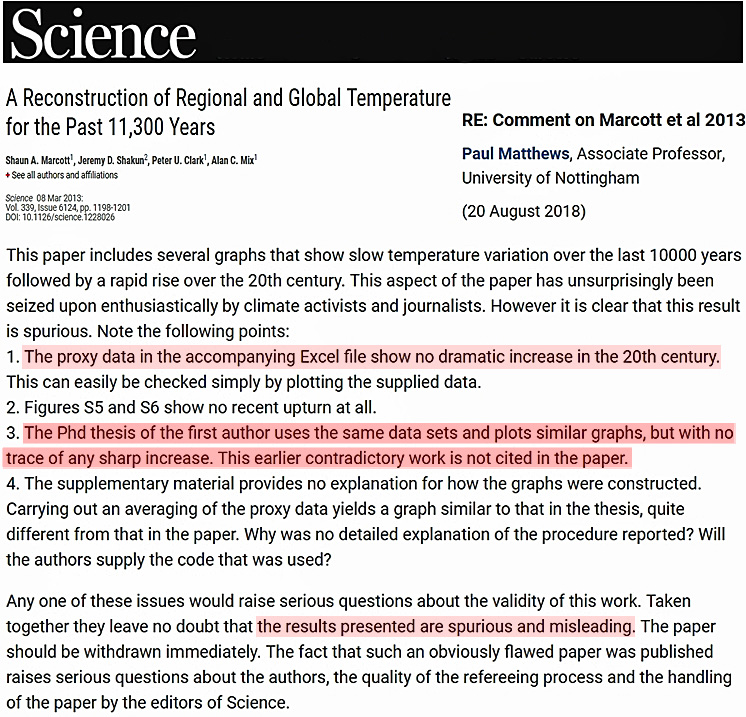
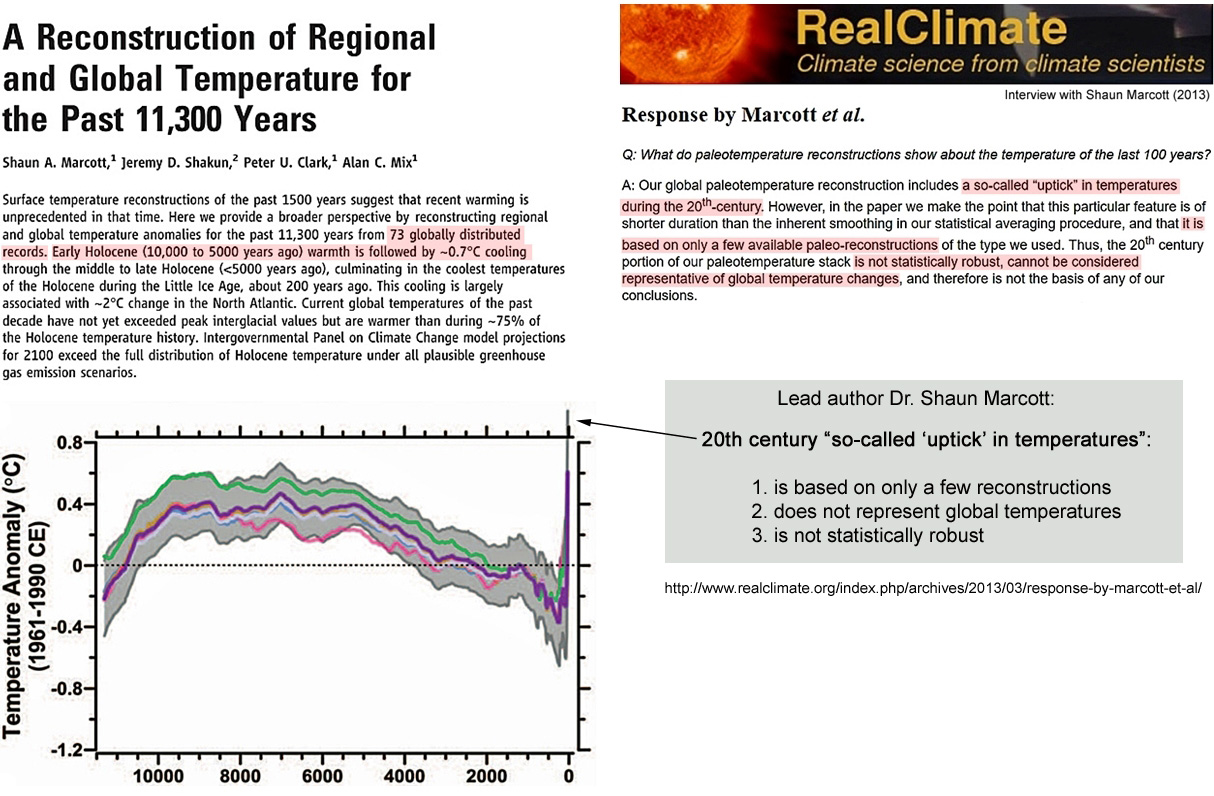
A valiant effort by Marcott et al. (2013) to recast 73 previously-published non-hockey stick Holocene reconstructions as supporting an unprecedented 20th century “uptick” was debunked by Marcott’s own 2011 doctoral thesis.
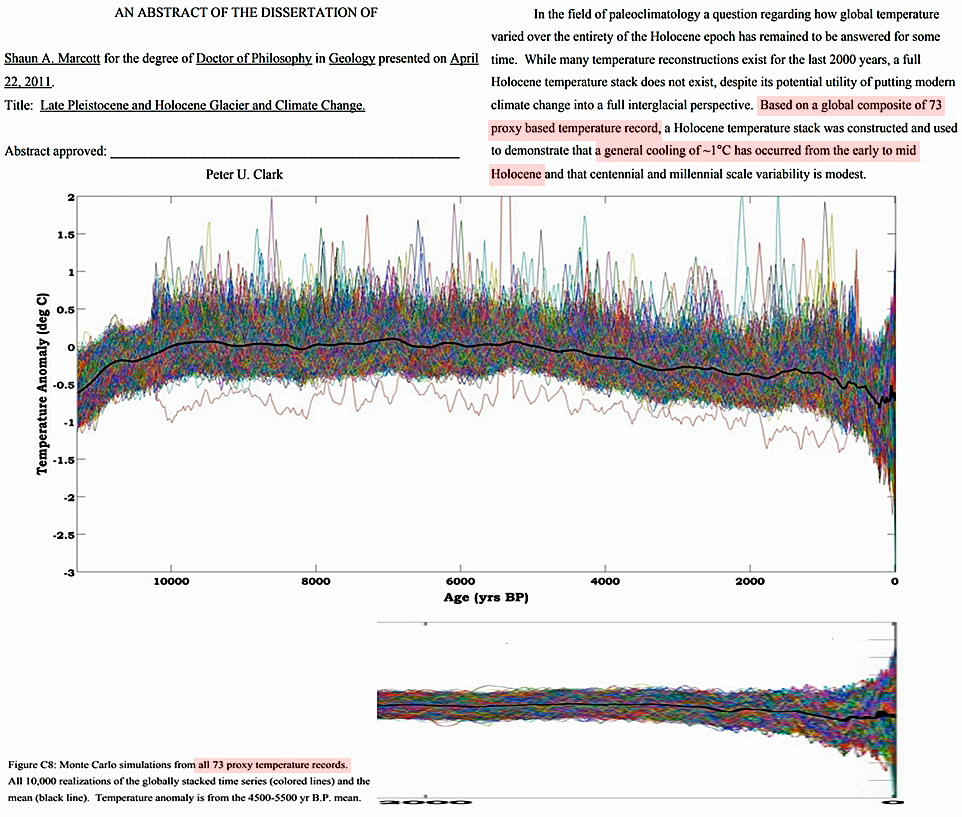
The non-statistically robust and non-globally representative temperature graph concocted by Marcott and colleagues also does not stand up to even the most rudimentary peer analysis.
Not only that, but they were long ago exposed for having substituted their own dates rather than using published results.
The Explosive Growth of the Non-Hockey Stick
In the last 25 months, 265 peer-reviewed scientific papers have been published containing documented evidence (i.e., graphs primarily) that undermine the popularized conception of a slowly-cooling Earth followed by a dramatic hockey-stick-shaped recent uptick, or an especially unusual global-scale warming during modern times.
253 Non-Global Warming Papers (2017 & 2018)
Indeed, some regions of the Earth have been warming in recent decades or at some point in the last 150 years. Some regions have been cooling for decades at a time.
And many regions have shown no significant net changes or trends in either direction relative to the last few decades to hundreds to thousands of years.
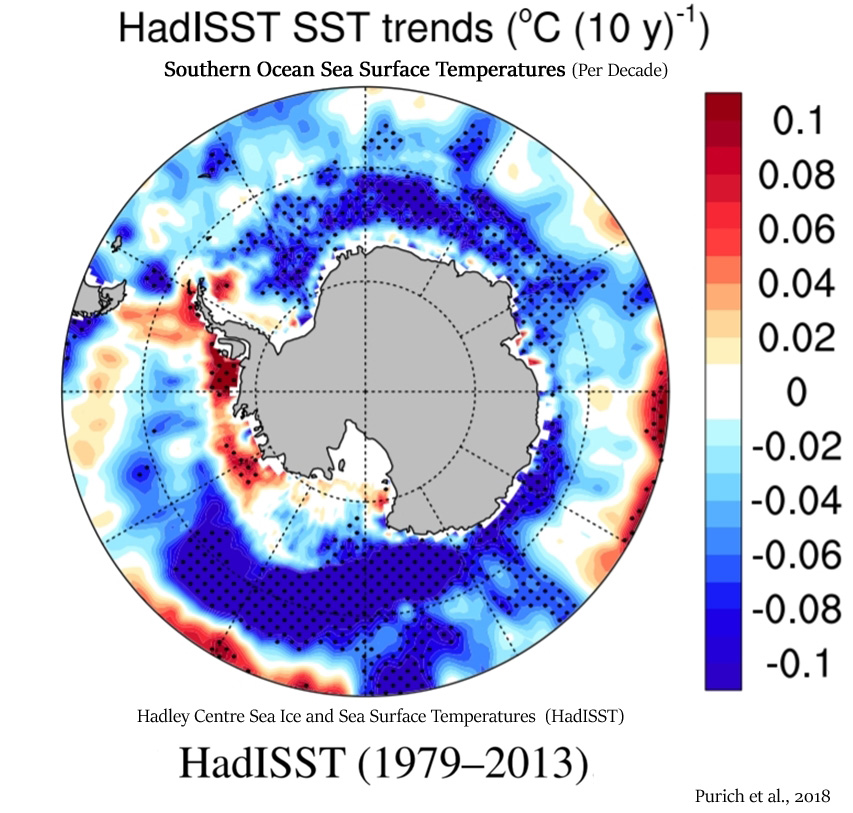
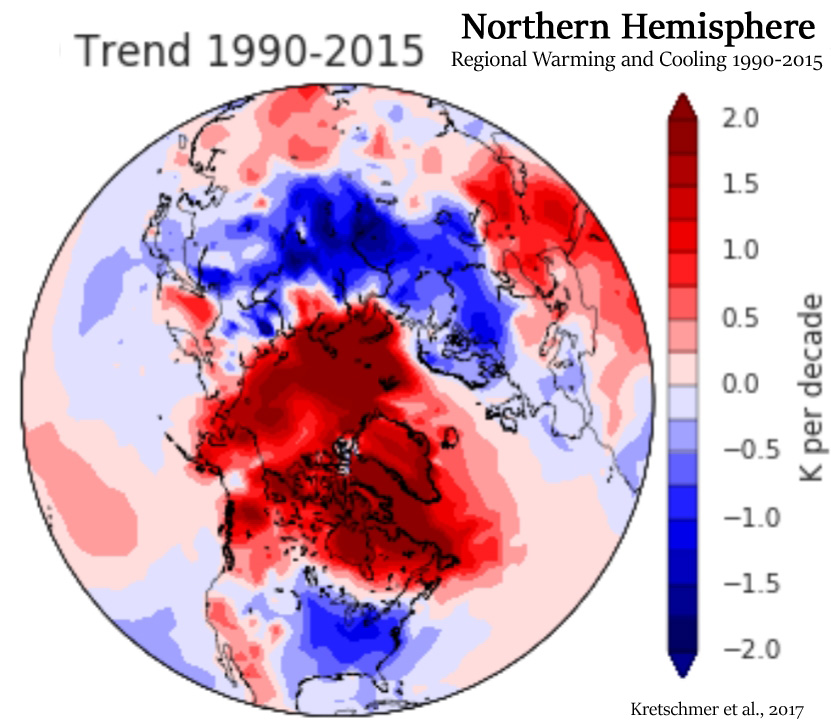
Image Source: Purich et al., 2018, Kretschmer et al., 2017
“The mean slope implies a change over 20 years [1994-2013] of 0.0213 ± 0.0014 °C”
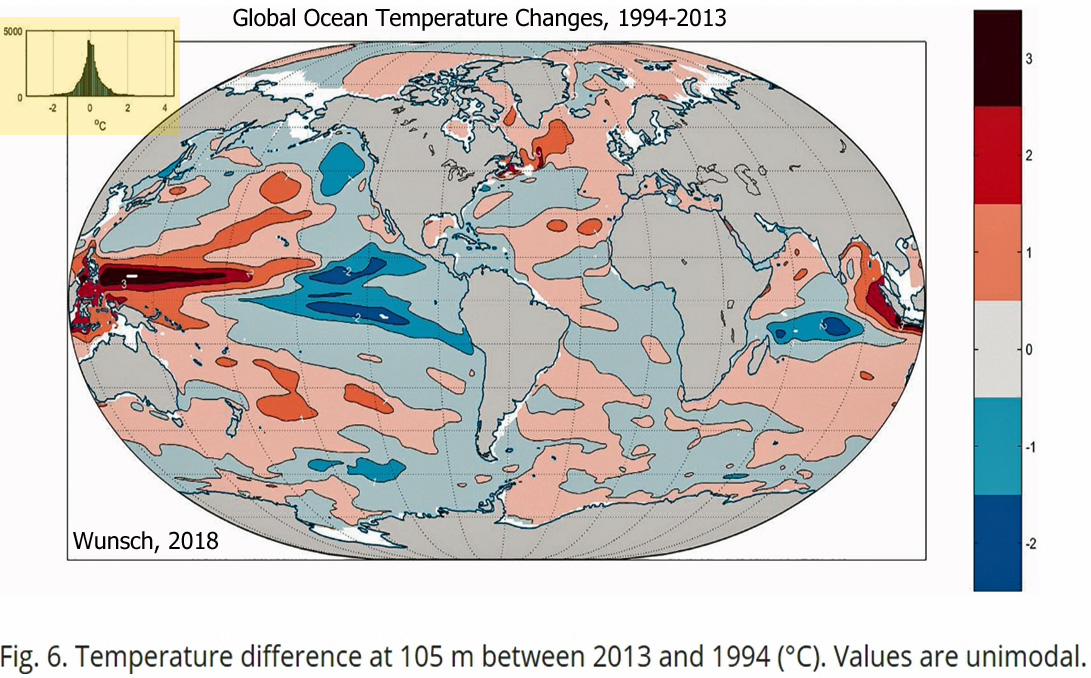
Image Source: Wunsch, 2018
Succinctly, then, scientists publishing in peer-reviewed journals have increasingly provided documentation that there is nothing historically unprecedented or remarkable about today’s climate when viewed in the context of long-term natural variability.
The compilation of non-global warming evidence continues in 2019. Twelve papers have been published thus far this year.
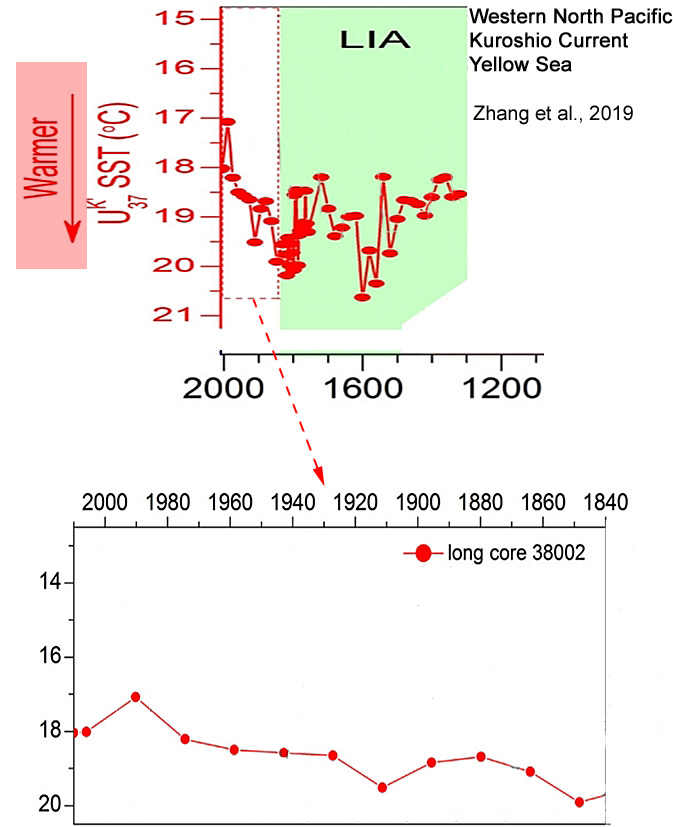
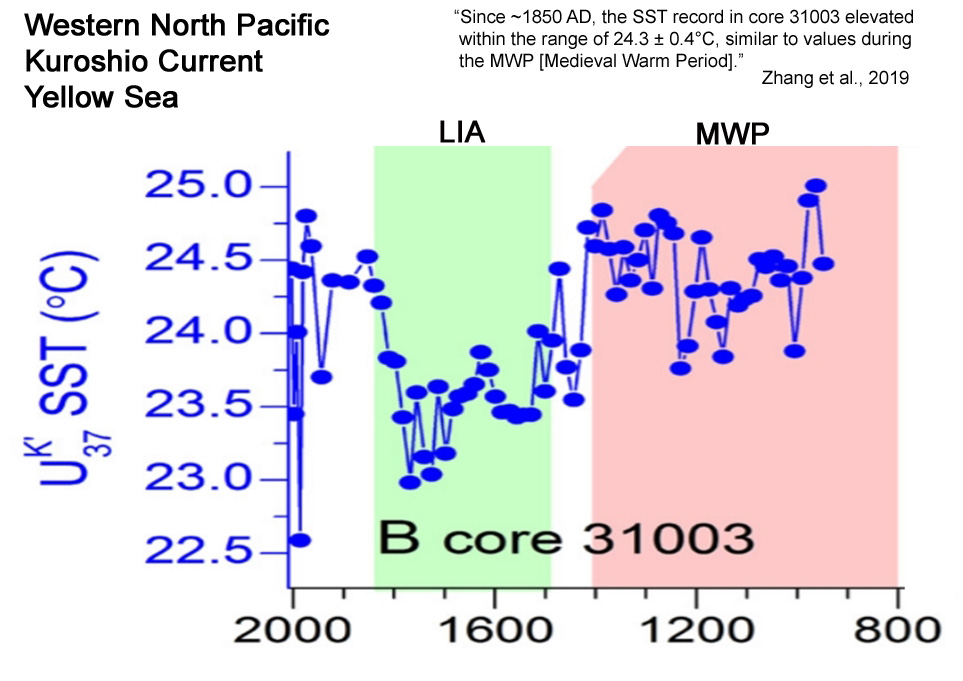
“In core 31003, the SST record shows a distinctly anti-phase relationship with that of core 38002 over the last millennium. For instance, from the MWP to LIA, SST values increased from ∼17.0 ± 0.3°C to ∼19.1 ± 0.6°C in the northern core 38002 but decreased from ∼24.3 ± 0.4°C to ∼23.5 ± 0.3°C in the southern coastal core 31003. Since ∼1850 AD, the SST record in core 31003 elevated within the range of 24.3 ± 0.4°C, similar to values during the MWP, but decreased gradually to ∼18.0°C in core 38002, in line with the SST trends at two additional locations from the YSWC [Yellow Sea Warm Current] pathway as reported by He et al. (2014).”
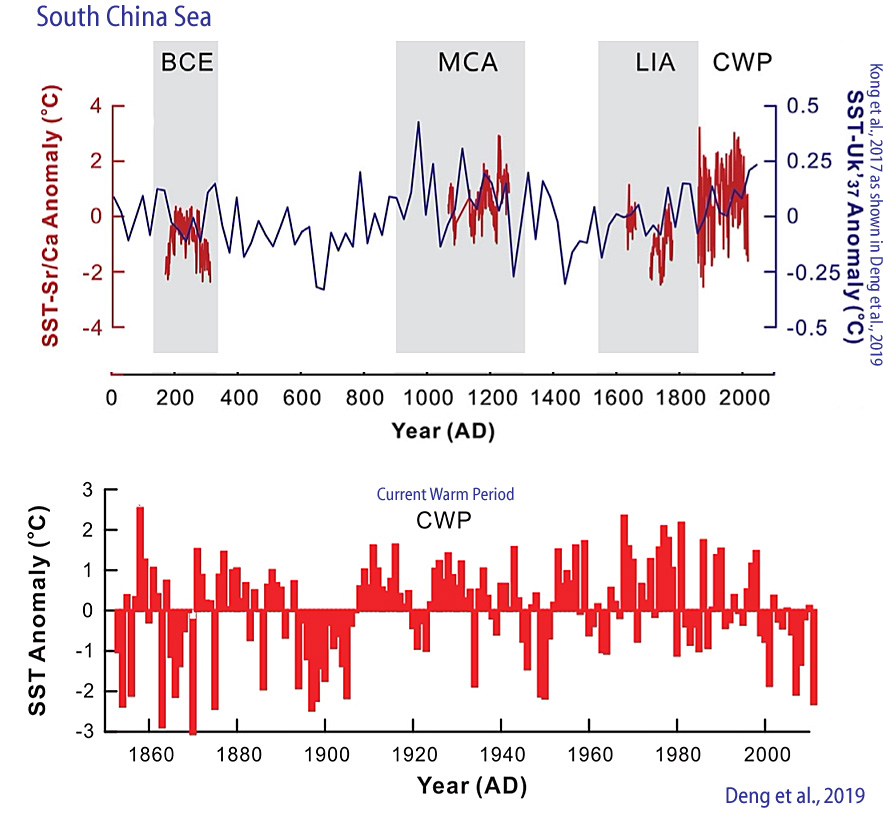
“Recent SST records based on longchain alkenones imply that the MCA [Medieval Climate Anomaly] was slightly warmer than the CWP [Current Warm Period] in the northern SCS [South China Sea] (Kong et al., 2017). … [I]t still should be noted that the SST record reconstructed from a Tridacna gigas Sr/Ca profile by Yan et al. (2015a) suggested that the annual average SST was approximately 0.89°C higher during the MCA [Medieval Climate Anomaly] than that of the CWP [Current Warm Period].”
“Diatom-based transfer functions for salinity, precipitation and temperature were developed using a training set that included data from 40 sites along central Mexico. … Maximum last glacial cooling of ∼5°C is reconstructed, a relatively wet deglacial and a warmer (+3.5°C) early Holocene. … The early Holocene marked a change towards high lake salinities and the highest positive temperature anomalies (+3.5°C) during a peak in summer insolation.”
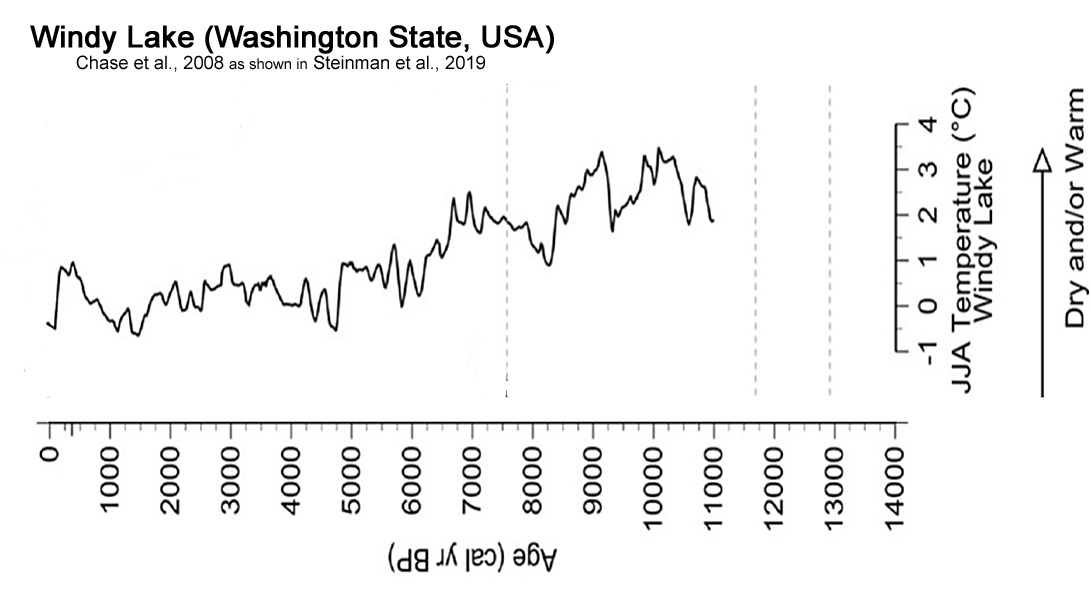
“The early Holocene d18O [hydroclimate] maximum in the Castor Lake record at 9630 (9110-10,100) yr BP is likely in part a result of higher summer insolation, which produced higher temperatures and greater evaporation during the warm season. Additionally, atmospheric circulation in the early Holocene was substantially different from the modern configuration (Bartlein et al., 2014), and precipitation amounts were likely lower, due to the presence of the residual Laurentide and Cordilleran Ice Sheets (Dyke, 2004), which affected air mass trajectories and the seasonal distribution and amount of precipitation on a hemispheric scale. … A chironomid based climate reconstruction from Windy Lake, south-central British Columbia, supports the assertion that greater summer insolation produced warmer summer temperatures at this time (Chase et al., 2008).”
Lozhkin et al., 2019 (SW Beringia)
“Mixed Larix-Betula forest was established at the Tanon site by ∼6600 14C BP (∼7500 cal BP). This forest included Betula platyphylla, a species common in moderate zones of the Russian Far East (e.g., B. platyphylla-Larix forests of central Kamchatka). The importance of Betula in the Middle Holocene assemblage is unusual, as tree Betula is not a common element in the modern coastal forest. The abundance of B. platyphylla macrofossils particularly suggests warmer than present summers and an extended growing period. This inference is supported by a regional climate model that indicates a narrow coastal region where the growing season was longer and summer temperatures were 2-4 °C warmer than today. Variations in Betula pollen percentages at other sites in northern Priokhot’ye are suggestive that this Middle Holocene forest was widespread along the coast.”
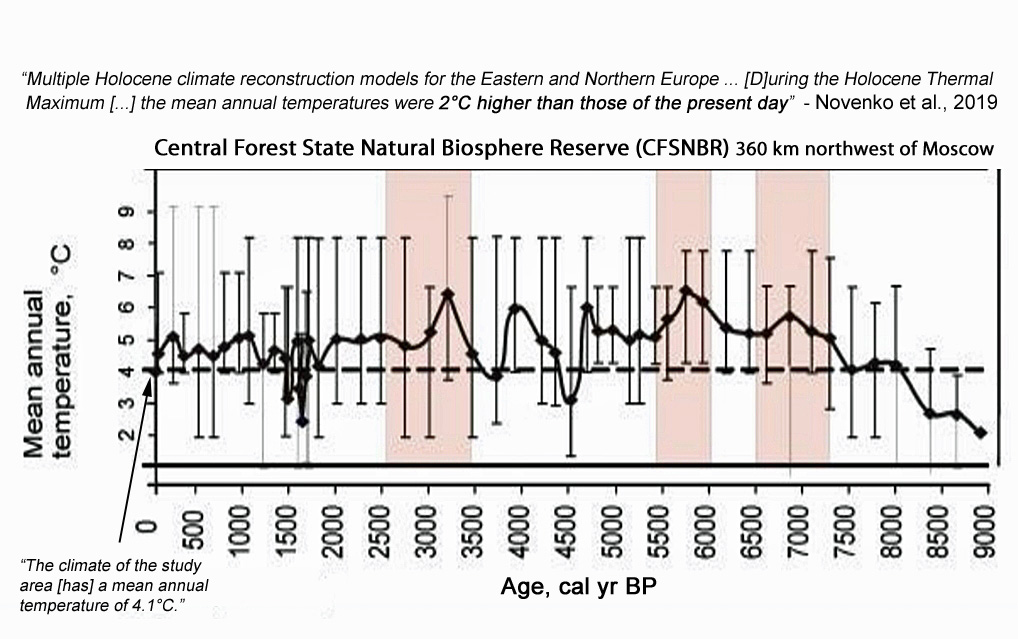
“[D]uring the Holocene Thermal Maximum when the mean annual temperatures were 2°С higher than those of the present day [6,9,10,11]. Roughly 5.7–5.5 ka BP, the Holocene Thermal Maximum was followed by gradual climatic cooling that included several warming and cooling phases with temperature fluctuations ranging between 2 and 3°С. …The CFSNBR [Central Forest State Natural Biosphere Reserve] is situated roughly 360 km northwest of Moscow (the Tver region, 56º35’ N, 32º55’ E) in an ecological zone transitioning from taiga to broadleaf forests. The vegetation of the CFSNBR is primary southern taiga forests, and it has been undisturbed by any human activities for at least 86 years. The climate of the study area is temperate and moderately continental with a mean annual temperature of 4.1°C and annual precipitation of roughly 700 mm [4].”
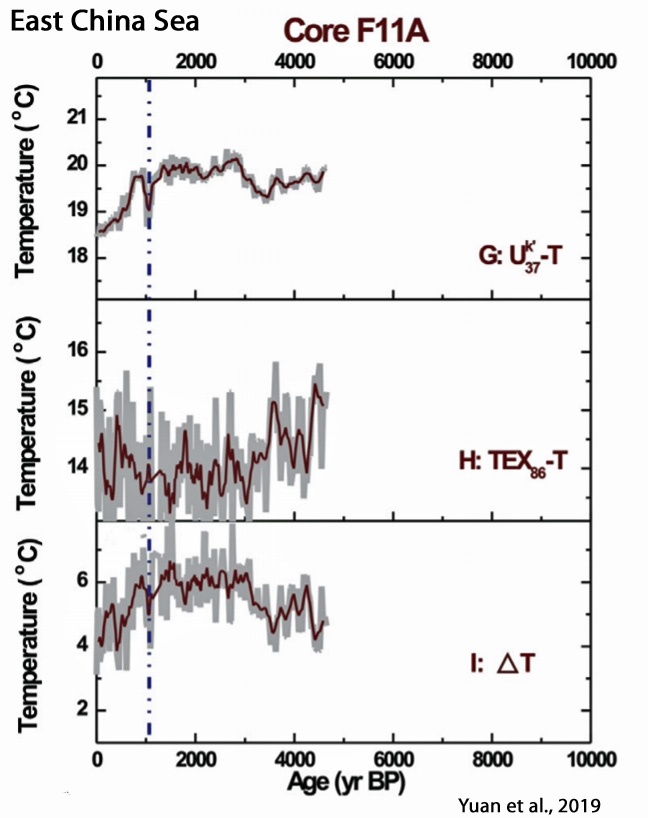
“During the early Holocene (10.0–6.0 ka), the modern-type circulation system was not established, which resulted in strong water column stratification; and the higher sea surface temperature (SST) might be associated with the Holocene Thermal Maximum (HTM). The interval of 6.0 to 1.0/2.0 ka displayed a weaker stratification caused by the intrusion of the Yellow Sea Warm Current (YSWC) and the initiation of the circulation system. A decreasing SST trend was related to the formation of the cold eddy generated by the circulation system in the ECS. During 1.0/2.0 to 0 ka, temperatures were characterized by much weaker stratification and an abrupt decrease of SST caused by the enhanced circulation system and stronger cold eddy, respectively.”
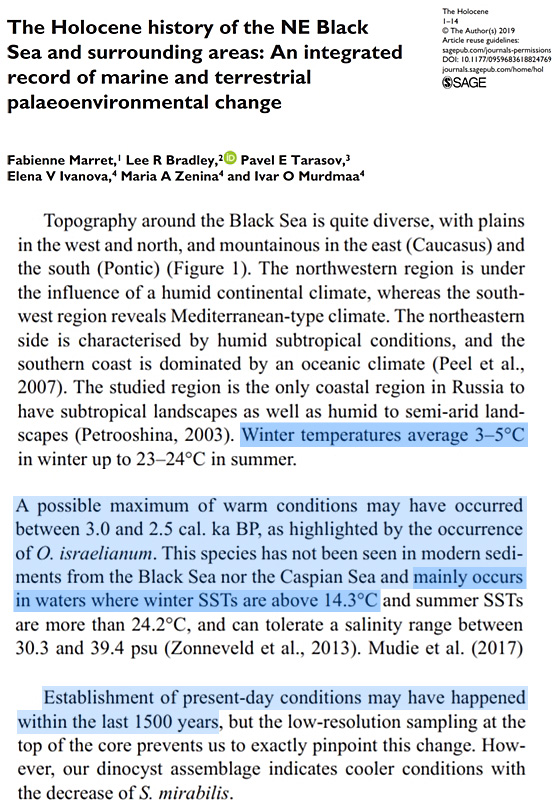
“The studied region is the only coastal region in Russia to have subtropical landscapes as well as humid to semi-arid landscapes (Petrooshina, 2003). Winter temperatures average 3–5°C in winter up to 23–24°C in summer. … A possible maximum of warm conditions may have occurred between 3.0 and 2.5 cal. ka BP, as highlighted by the occurrence of O. israelianum. This species has not been seen in modern sediments from the Black Sea nor the Caspian Sea and mainly occurs in waters where winter SSTs are above 14.3°C and summer SSTs are more than 24.2° C … Establishment of present-day conditions may have happened within the last 1500 years, but the low-resolution sampling at the top of the core prevents us to exactly pinpoint this change. However, our dinocyst assemblage indicates cooler conditions [today] with the decrease of S. mirabilis.”
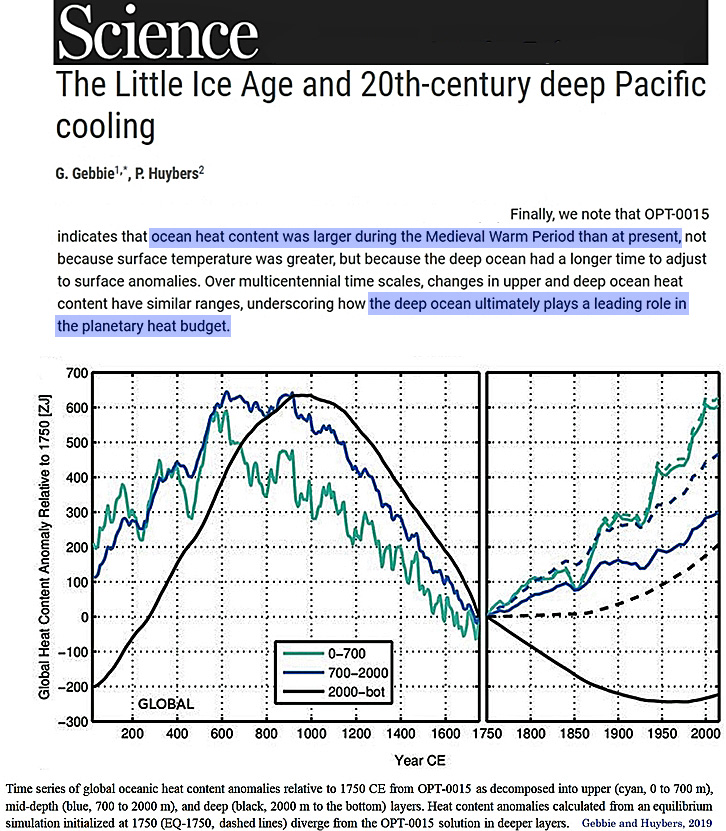
“The ongoing deep Pacific is cooling, which revises Earth’s overall heat budget since 1750 downward by 35%. … In the deep Pacific, we find basin-wide cooling ranging from 0.02° to 0.08°C at depths between 1600 and 2800 mthat is also statistically significant. The basic pattern of Atlantic warming and deep-Pacific cooling diagnosed from the observations is consistent with our model results, although the observations indicate stronger cooling trends in the Pacific. …. At depths below 2000 m, the Atlantic warms at an average rate of 0.1°C over the past century, whereas the deep Pacific cools by 0.02°C over the past century. … These basin-wide average trends are used to relax the assumption of globally uniform changes in surface conditions and to constrain regional temperature histories for 14 distinct regions over the Common Era by a control theory method. The result, referred to as OPT-0015, fits the observed vertical structure of Pacific cooling and Atlantic warming. Global surface changes still explain the basic Atlantic-Pacific difference in OPT-0015, but greater Southern Ocean cooling between 600 and 1600 CE leads to greater rates of cooling in the deep Pacific over recent centuries. … OPT-0015 indicates that the upper 2000 m of the ocean has been gaining heat since the 1700s, but that one-fourth of this heat uptake was mined from the deeper ocean. This upper-lower distinction is most pronounced in the Pacific since 1750, where cooling below 2000 m offsets more than one-third of the heat gain above 2000 m. … Finally, we note that OPT-0015 indicates that ocean heat content was larger during the Medieval Warm Period than at present, not because surface temperature was greater, but because the deep ocean had a longer time to adjust to surface anomalies. Over multicentennial time scales, changes in upper and deep ocean heat content have similar ranges, underscoring how the deep ocean ultimately plays a leading role in the planetary heat budget.”
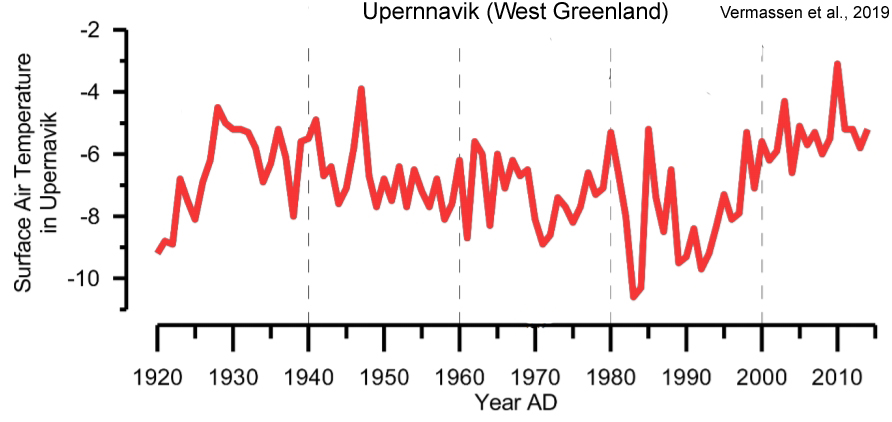
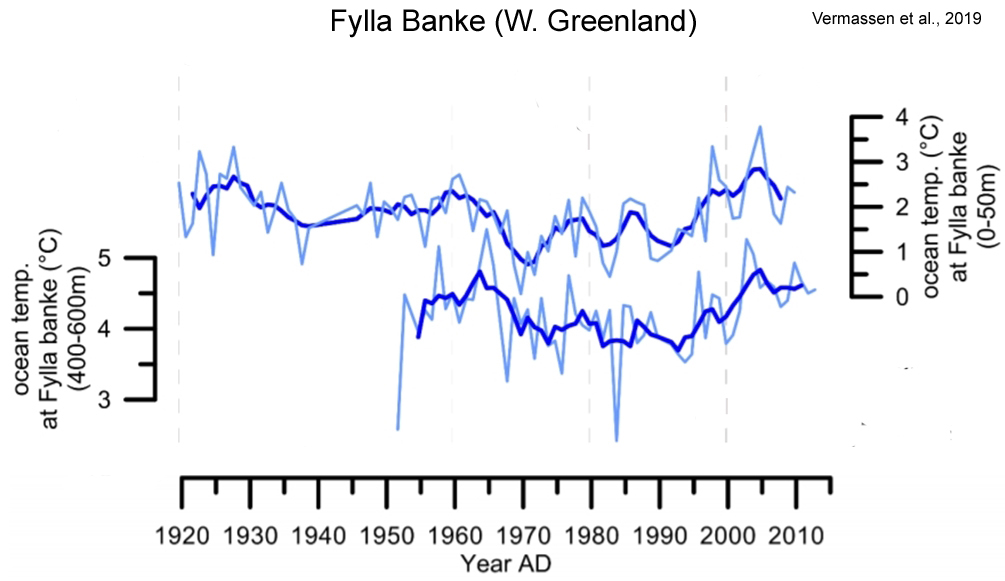
“[O]ur study shows that while warming of ocean waters in Upernavik fjord likely contributed to the retreat phases during the 1930s and early 2000s, ocean warming is not a prerequisite for retreat of Upernavik Isstrøm. … This is important since it implies that the future potential oceanic forcing of Upernavik Isstrøm will depend on changes related to circulation in the North Atlantic (i.e. the AMO). Since the meridional overturning circulation strength and associated heat transport is currently declining, (Frajka-Williams et al., 2017), this may lead to cooling bottom waters during the next decade in Upernavik Fjord and most likely also other fjords in West-Greenland.”
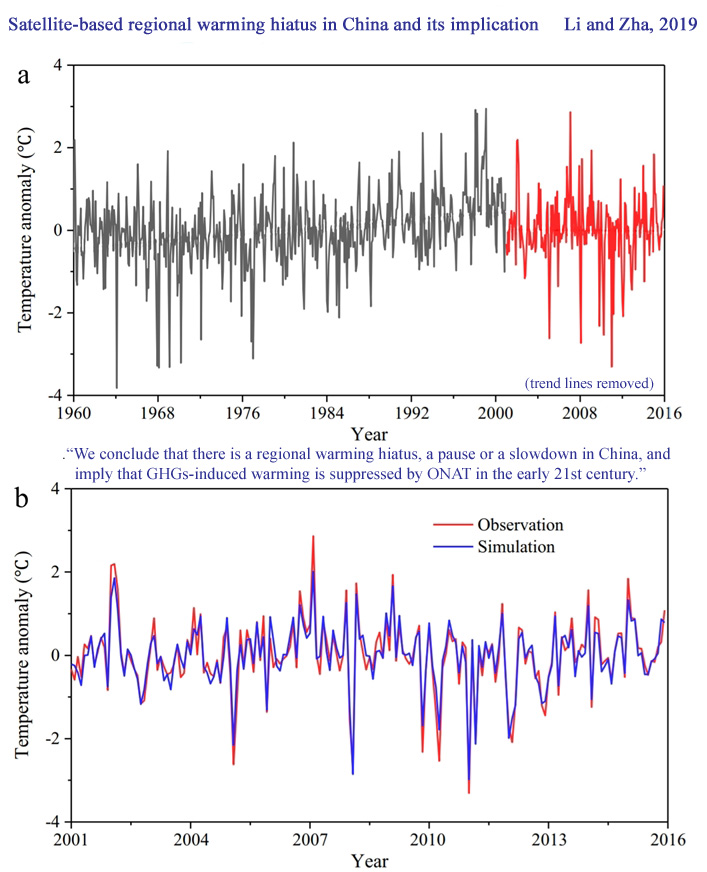
“Global warming ‘stalled’ or ‘paused’ for the period 1998–2012, as claimed by the Intergovernmental Panel on Climate Change (IPCC) Fifth Assessment Report (AR5) (IPCC, 2013). However, the early drafts of IPCC AR5 have no detailed explanation for this “hiatus” since 111 of 114 climate models in the CMIP5 earth system model did not verify this phenomenon. … In 2017, after a wave of scientific publications and public debate, the climate models as reported in IPCC remain debates, including definitions of “hiatus” and datasets (Medhaug et al., 2017)…. The slowdown in global warming since 1998, often termed the global warming hiatus. Reconciling the “hiatus” is a main focus in the 2013 climate change conference. Accurately characterizing the spatiotemporal trends in surface air temperature (SAT) is helps to better understand the “hiatus” during the period. This article presents a satellite-based regional warming simulation to diagnose the “hiatus” for 2001–2015 in China. Results show that the rapid warming is mainly in western and southern China, such as Yunnan (mean ± standard deviation: 0.39 ± 0.26 °C (10 yr)−1 ), Tibet (0.22 ± 0.25 °C (10 yr)−1), Taiwan (0.21 ± 0.25 °C (10 yr)−1), and Sichuan (0.19± 0.25 °C (10 yr)−1). On the contrary, there is a cooling trend by 0.29 ± 0.26 °C (10 yr)−1 in northern China during the recent 15 yr, where a warming rate about 0.38 ± 0.11 °C (10 yr)−1 happened for 1960–2000. Overall, satellite simulation shows that the warming rate is reduced to −0.02 °C (10 yr)−1. The changes in underlying surface, Earth’s orbit, solar radiation and atmospheric counter radiation (USEOSRACR) cause China’s temperature rise about 0.02 °C (10 yr)−1. A combination of greenhouse gases (GHGs) and other natural forcing (ONAT, predominately volcanic activity, and atmosphere and ocean circulation) explain another part of temperature trend by approximately −0.04 °C (10 yr)−1. We conclude that there is a regional warming hiatus, a pause or a slowdown in China, and imply that GHGs-induced warming is suppressed by ONAT in the early 21st century.”
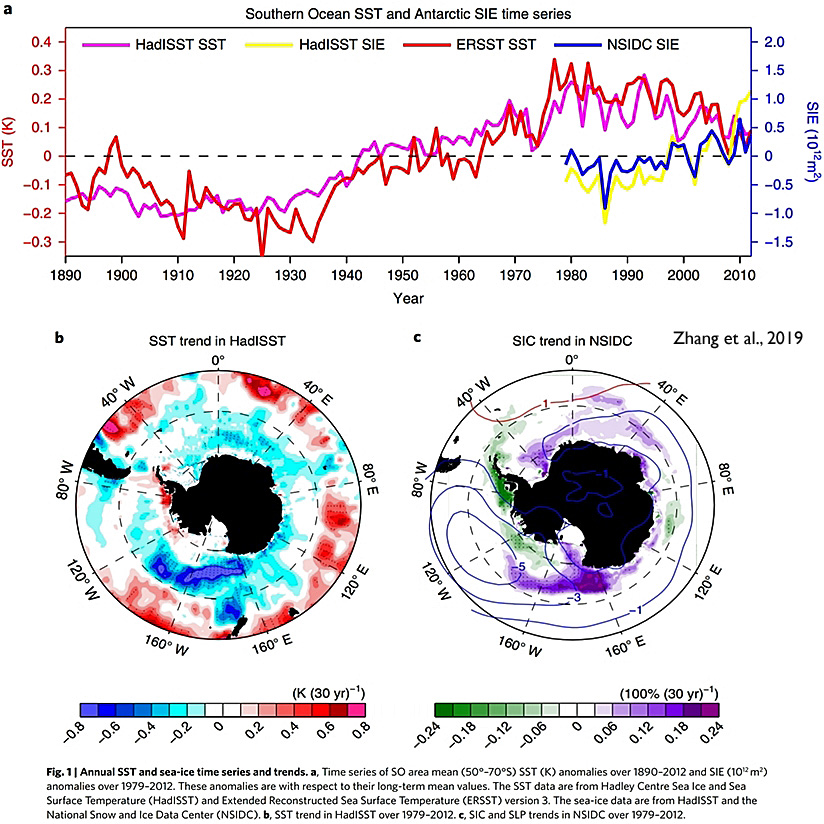
“Observed Southern Ocean surface cooling and sea-ice expansion over the past several decades are inconsistent with many historical simulations from climate models. Here we show that natural multidecadal variability involving Southern Ocean convection may have contributed strongly to the observed temperature and sea-ice trends.”


