In the first 9½ months of 2018, 368 scientific papers have been published that cast doubt on the position that anthropogenic CO2 emissions function as the climate’s fundamental control knob…or that otherwise serve to question the efficacy of climate models or the related “consensus” positions commonly endorsed by policymakers and mainstream media sources.
These 368 new papers affirm the position that there are significant limitations and uncertainties inherent in our understanding of climate and climate changes, emphasizing that climate science is not settled.
More specifically, the papers in this compilation support these four main skeptical positions — categorized here as N(1) – N(4) — which question climate alarm.
N(1) Natural mechanisms play well more than a negligible role (as claimed by the IPCC) in the net changes in the climate system, which includes temperature variations, precipitation patterns, weather events, etc., and the influence of increased CO2 concentrations on climatic changes are less pronounced than currently imagined.
N(2) The warming/sea levels/glacier and sea ice retreat/hurricane and drought intensities…experienced during the modern era are neither unprecedented or remarkable, nor do they fall outside the range of natural variability.
N(3) The computer climate models are neither reliable or consistently accurate, and projections of future climate states are little more than speculation as the uncertainty and error ranges are enormous in a non-linear climate system.
N(4) Current emissions-mitigation policies, especially related to the advocacy for renewables, are often ineffective and even harmful to the environment, whereas elevated CO2 and a warmer climate provide unheralded benefits to the biosphere (i.e., a greener planet and enhanced crop yields).
In sharp contrast to the above, the corresponding “consensus” positions that these papers do not support are:
A(1) Close to or over 100% (110%) of the warming since 1950 has been caused by increases in anthropogenic CO2 emissions, leaving natural attribution at something close to 0%.
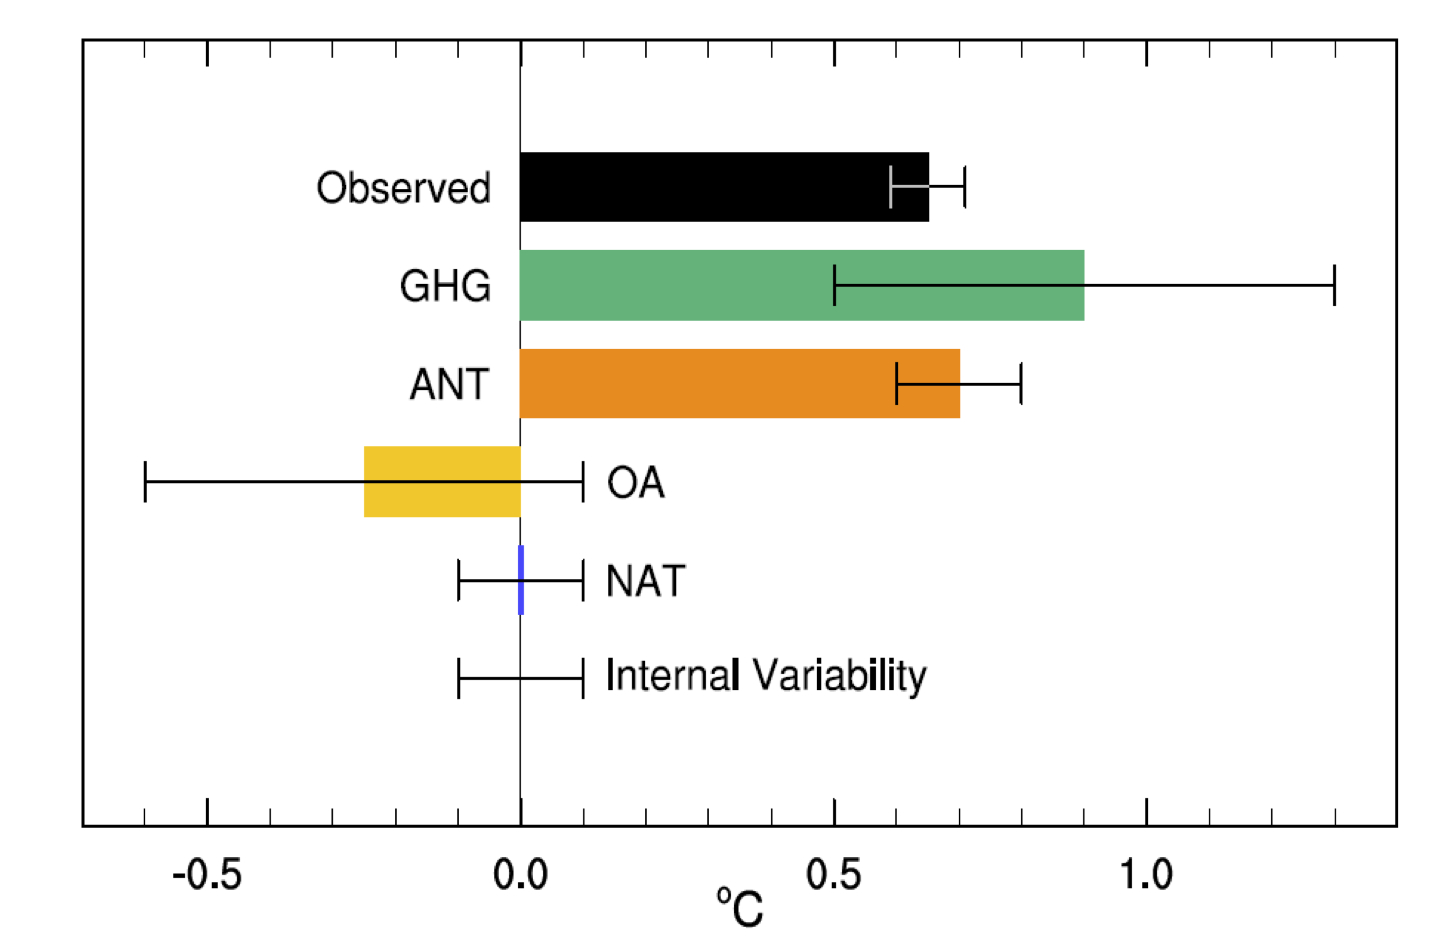
RealClimate.org: “The best estimate of the warming due to anthropogenic forcings (ANT) is the orange bar (noting the 1 uncertainties). Reading off the graph, it is 0.7±0.2ºC (5-95%) with the observed warming 0.65±0.06 (5-95%). The attribution then follows as having a mean of ~110%, with a 5-95% range of 80–130%. This easily justifies the IPCC claims of having a mean near 100%, and a very low likelihood of the attribution being less than 50% (p < 0.0001!).”
A(2) Modern warming, glacier and sea ice recession, sea level rise, drought and hurricane intensities…are all occurring at unprecedentedly high and rapid rates, and the effects are globally synchronous (not just regional)…and thus dangerous consequences to the global biosphere and human civilizations loom in the near future as a consequence of anthropogenic influences.
A(3) The climate models are reliable and accurate, and the scientific understanding of the effects of both natural forcing factors (solar activity, clouds, water vapor, etc.) and CO2 concentration changes on climate is “settled enough“, which means that “the time for debate has ended“.
A(4) The proposed solutions to mitigate the dangerous consequences described in N(4) – namely, wind and solar expansion – are safe, effective, and environmentally-friendly.
To reiterate, the 368 papers compiled in 2018 thus far support the N(1)-N(4) positions, and they undermine or at least do not support the “consensus” A(1)-A(4) positions. The papers do not do more than that. Expectations that these papers should do more than support skeptical positions and undermine “consensus” positions to “count” are deemed unreasonable in this context.
Below are the three links to the list of 2018 papers amassed as of the 15th of October, 2018, as well as the guideline for the lists’ categorization.
Finally, a sampling of some of the new papers is also included below.
Warming Since Mid/Late 20th Century? (30)
A Warmer Past: Non-Hockey Stick Reconstructions (58)
Lack Of Anthropogenic/CO2 Signal In Sea Level Rise (12)
Sea Levels Multiple Meters Higher 4,000-7,000 Years Ago (12)
A Model-Defying Cryosphere, Polar Ice (25)
Mass Extinction Events Caused By Glaciation, Sea Level Fall (3)
Antarctic Ice Melting In High Geothermal Heat Flux Areas (2)
Abrupt, Degrees-Per-Decade Natural Global Warming (5)
Solar Influence On Climate (78)
ENSO, NAO, AMO, PDO Climate Influence (19)
Modern Climate In Phase With Natural Variability (8)
Cloud/Aerosol Climate Influence (4)
Volcanic/Tectonic Climate Influence (2)
The CO2 Greenhouse Effect – Climate Driver? (9)
Climate Model Unreliability/Biases/Errors and the Pause (19)
Urban Heat Island: Raising Surface Temperatures Artificially (3)
Failing Renewable Energy, Climate Policies (11)
Wind Power Harming The Environment, Biosphere (10)
Elevated CO2: Greens Planet, Higher Crop Yields (7)
Warming Beneficial, Does Not Harm Humans, Wildlife (7)
Warming, Acidification Not Harming Oceanic Biosphere (7)
Coral Bleaching A Natural, Non-Anthropogenic Phenomenon (2)
No Increasing Trends In Intense Hurricanes (6)
No Increasing Trend In Drought/Flood Frequency, Severity (6)
Natural CO2 Emissions A Net Source, Not A Net Sink (5)
Global Fire Frequency Declining As CO2 Rises (2)
CO2 Change Lags Temperature Change By 1000+ Years (3)
Miscellaneous (12)
Scientists: We Don’t Understand (1)
Non-Hockey Sticks: A Few Thousand Years Ago It Was 1-3°C Warmer Than Today
Papadomanolaki et al., 2018 (Baltic Sea) A large fraction of the Baltic Proper became hypoxic again between 1.4 and 0.7 ka BP, during the Medieval Climate Anomaly (MCA), when mean air temperatures were 0.9–1.4 °C higher than temperatures recorded in the period 1961–1990 (e.g. Mann et al., 2009; Jilbert and Slomp, 2013).
Leonard et al., 2018 (Great Barrier Reef, Australia) Coral derived sea surface temperature (SST-Sr/Ca) reconstructions demonstrate conditions ∼1 ◦C warmer than present at ∼6200 (recalibrated 14C) and 4700 yr BP, with a suggested increase in salinity range (δ18O) associated with amplified seasonal flood events, suggestive of La Niña (Gagan et al., 1998; Roche et al., 2014).
Suvorov and Kitov, 2018 (Eastern Sayan, Siberia) The authors examined the variability of activity of modern glaciation and variation of natural conditions of the periglacial zone on climate and on dendrochronological data. Results of larch and Siberian stone pine growth data were revealed at the higher border of forest communities. … It is believed that the temperature could be 3.5 °C warmer at the Holocene optimum than at the present time (Vaganov and Shiyatov 2005). … Since 2000, there has been growth of trees instability associated with a decrease in average monthly summer temperatures. … Since the beginning of 2000, decrease in summer temperatures was marked.
Lozhkin et al., 2018 (East Siberia) The postglacial occurrence of relatively warm/dry and warm/wet intervals is consistent with results of a regional climate‐model simulation that indicates warmer than present temperatures and decreased effective moisture at 11 000 cal. a BP and persistence of warm conditions but with greater moisture and longer growing season at 6000 cal. a BP.
Smith, 2018 (Greenland Ice Sheet) To project how much sea level will rise in response to ongoing climate warming, one of the things we need to know is how sensitive the rate of Greenland Ice Sheet melting is to rising temperatures. McFarlin et al. present results from a set of sediment cores from a small nonglacial lake in the highlands of northwest Greenland, which contain deposits from the Holocene and the Last Interglacial (LIG). They found midge assemblages indicating peak July temperatures that were 4.0° to 7.0°C warmer than modern temperatures during the early Holocene and at least 5.5° to 8.5°C warmer during the LIG. This perspective of extreme warming suggests that even larger changes than predicted for this region over the —–coming century may be in store.
Kullman, 2018 (Scandes, Northern Sweden) The present paper reports results from an extensive project aiming at improved understanding of postglacial subalpine/alpine vegetation, treeline, glacier and climate history in the Scandes of northern Sweden. The main methodology is analyses of mega fossil tree remnants, i.e. trunks, roots and cones, recently exposed at the fringe of receding glaciers and snow/ice patches. This approach has a spatial resolution and accuracy, which exceeds any other option for tree cover reconstruction in high-altitude mountain landscapes. … All recovered tree specimens originate from exceptionally high elevations, about 600-700 m atop of modern treeline positions. … Conservatively drawing on the latter figure and a summer temperature lapse rate of 0.6 °C per 100 m elevation (Laaksonen 1976), could a priori mean that, summer temperatures were at least 4.2 °C warmer than present around 9500 year before present. However, glacio-isostatic land uplift by at least 100 m since that time (Möller 1987; Påsse & Anderson 2005) implies that this figure has to be reduced to 3.6 °C higher than present-day levels, i.e. first decades of the 21st century. Evidently, this was the warmth peak of the Holocene, hitherto. This inference concurs with paleoclimatic reconstructions from Europe and Greenland (Korhola et al. 2002; Bigler et al. 2003; Paus 2013; Luoto et al. 2014; Väliranta et al. 2015).
Borisova, 2018 (central East European Plain) Paleobotanical assemblages from peat, lake, and archaeological deposits reveal that during the Middle Holocene (MH; ca. 9.0 to 4.7 kyr BP), the central East European Plain was occupied by highly productive and diverse mixed-oak forests, along with mire, meadow, and riverine communities. Climatic reconstructions based on modern analogues of fossil pollen and plant macrofossil assemblages indicate that throughout the MH [Middle Holocene] mean annual precipitation was at near present levels (~600 mm) and July temperatures were similar to those of today (~17°C). However, differences in the Fossil Floras (FFs) suggest changes in winter conditions though the MH [Middle Holocene, 9.0 to 4.7 kyr BP], with January temperatures higher than the present-day value of -10°C by 2°C in the Early Atlantic, 6°C in the Middle Atlantic, and 3°C in the Late Atlantic-Early Subboreal. The annual frost-free period was 15 days longer than today in the Early Atlantic, about one month longer in the Late Atlantic, and became close to present by the beginning of the Subboreal. The combination of warm winters with diverse and productive vegetation communities provided an environment that was more hospitable than that of today for Late Mesolithic and Neolithic societies.
McFarlin et al., 2018 (Greenland) Early Holocene peak warmth has been quantified at only a few sites, and terrestrial sedimentary records of prior interglacials are exceptionally rare due to glacial erosion during the last glacial period. Here, we discuss findings from a lacustrine archive that records both the Holocene and the Last Interglacial (LIG) from Greenland, allowing for direct comparison between two interglacials. Sedimentary chironomid assemblages indicate peak July temperatures [Greenland] 4.0 to 7.0 °C warmer than modern during the Early Holocene maximum [10,000 to 8,000 years ago] in summer insolation. Chaoborus and chironomids in LIG sediments indicate July temperatures at least 5.5 to 8.5 °C warmer than modern.
Bartels et al., 2018 (North Atlantic Region) During summer, AW [Atlantic Water] rises up to waterdepths as shallow as ~55 m. … Summer surface temperatures [1955-2012] range between up to 3°C at the northern mouth and <-1.5 °C at the southern mouth of the Hinlopen Strait, while winter surface temperatures vary between 0.5 and <~1.5°C(averaged, 1955–2012; Locarnini et al. 2013). … Increased summer insolation probably amplified the surface melting of the glaciers resulting in enhanced meltwater production and in a very high accumulation of finegrained sediments within the fjord […]. In addition, during the mild early Holocene conditions, summer sea-surface temperatures probably reaching 8–10°C [~5 – 9.5°C warmer than 1955-2012] (indicated by M. edulis findings as discussed in Hansen et al. 2011) may have contributed to reducing the number of glaciers that entered the fjord directly as tidewater glaciers and thus causing a diminished IRD input. These comparably warm surface temperatures most likely resulted in a reduced sea ice cover during summer, which is also reflected in the sea-ice biomarker data exhibiting lowest IP25 values during the early Holocene. … [G]lacier advances are most likely caused by atmospheric cooling as indicated, e.g. by d18O values from the Greenland NGRIP ice-core (Rasmussen et al. 2014a), by data from peats and permafrost soils on Spitsbergen (e.g. Humlum et al. 2003; Humlum 2005; Jaworski 2016), and by evidence that solar activity reduced around 2.7 ka, contributing to a cooling in both hemispheres (van Geel et al. 1999, 2000). … In lake sediments from northwestern Spitsbergen a temperature drop of ~6°C is recorded between c. 7.8 and c. 7 ka [-0.8°C per century], which has been connected to a stronger influence of Arctic Water and expanding sea ice (van der Bilt et al. 2018).
Street-Perrot et al., 2018 (Estonia) Estimates of summer temperatures in Estonia based on rapidly responding proxies such as aquatic macrofossils (Valiranta et al., 2015) and chironomids (Heiri et al., 2014) suggest conditions 2 °C warmer than today during the early Holocene.
Pozachenuk, 2018 (Western Russia) Mass peat accumulation in the territory of Vyatka region began only in the first half of the Atlantic Holocene period. The maximum warming corresponds to the second half of at (climatic optimum Holocene), when the average temperatures of January and July exceeded modern 2-3˚C. at this time in the region formed coniferous-broad-leaved forests of complex composition, with a slight presence of broad-leaved species (Qercus, Tilia, Ulmus) and Corulus. Siberian element of flora-fir on the territory of Vyatka region appeared only in the Subatlantic period of Holocene, most likely due to climatic conditions.
Kolaczek et al., 2018 (Southeastern Poland) The reconstruction of the mean July temperature based on Chironomidae revealed the exceptionally high rate of warming during the period of ca. 11,490–11,460 cal. BP (at least 1 °C per decade) up to values > 2 °C than modern ones. … Between ca. 11,490 and 11,460 cal. BP, the strongest warming trend in the Early Holocene MJT was registered, that is from 15 to 20.7°C (0.19°C yr1, 1.9°C/decade). Then, ca. 11,450 cal. BP, the temperature decreased to 18.3°C and up to ca. 10,560 cal. BP MJT fluctuated between 17 and 19°C. The climate of the area [today] is classified as cold temperate with mean annual air temperature of 8.2°C and mean annual precipitation 620 mm. A mean temperature of the warmest month, i.e. July, is +18.2°C[today], whereas a mean temperature of the coldest month, i.e. January, is -3.6°C.
Ruskeeniemi et al., 2018 (Greenland Ice Sheet) Towards the Holocene Climatic Optimum, temperatures steadily increased and were 2.5°C higher than at present during 8000-5000 cal years BP. It is suggested that the GrIS started to re-advance after 4400 cal years BP due to cooling, with 0.5°C lower temperatures than at present around 2000 years BP. Within the LIA, Dahl-Jensen et al. (1998) identified two cold periods at 1550 AD and 1850 AD, with temperatures respectively 0.5°C and 0.7°C below the present values. At around 1930 AD, the temperatures reached a maximum and have slightly decreased thereafter.
The CO2 Greenhouse Effect: Climate Driver?
Davis et al., 2018 [T]he contemporary global warming increase of ~0.8 °C recorded since 1850 has been attributed widely to anthropogenic emissions of carbon dioxide (CO2) into the atmosphere. Recent research has shown, however, that the concentration of CO2 in the atmosphere has been decoupled from global temperature for the last 425 million years [Davis, 2017] owing to well-established diminishing returns in marginal radiative forcing (ΔRF) as atmospheric CO2 concentration increases. Marginal forcing of temperature from increasing CO2 emissions declined by half from 1850 to 1980, and by nearly two-thirds from 1850 to 1999 [Davis, 2017]. Changes in atmospheric CO2 therefore affect global temperature weakly at most. The anthropogenic global warming (AGW) hypothesis has been embraced partly because “…there is no convincing alternative explanation…” [USGCRP, 2017] (p. 12). … The ACO [Antarctic Centennial Oscillation] provides a possible [natural] alternative explanation in the form of a natural climate cycle that arises in Antarctica, propagates northward to influence global temperature, and peaks on a predictable centennial timetable. … The period and amplitude of ACOs oscillate in phase with glacial cycles and related surface insolation associated with planetary orbital forces. We conclude that the ACO: encompasses at least the EAP; is the proximate source of D-O oscillations in the Northern Hemisphere; therefore affects global temperature; propagates with increased velocity as temperature increases; doubled in intensity over geologic time; is modulated by global temperature variations associated with planetary orbital cycles; and is the probable paleoclimate precursor of the contemporary Antarctic Oscillation (AAO). Properties of the ACO/AAO are capable of explaining the current global warming signal.
Smirnov, 2018 From this, it follows for the change of the global temperature as a result at doubling of the concentration of atmospheric CO2 molecules [is] ∆T = (0.4 ± 0.1) K, where the error accounts for the accuracy of used values, whereas the result depends on processes included in the above scheme. Indeed, we assume the atmospheric and Earth’s albedo, as well as another interaction of solar radiation with the atmosphere and Earth, to be unvaried in the course of the change of the concentration of CO2 molecules, and also the content of atmospheric water is conserved. Because anthropogenic fluxes of carbon dioxide in the atmosphere resulted from combustion of fossil fuels is about 5% [Kaufman, 2007], the contribution of the human activity to ECS (the temperature change as a result of doubling of the atmospheric carbon dioxide amount) is ∆T = 0.02 K, i.e. injections of carbon dioxide in the atmosphere as a result of combustion of fossil fuels is not important for the greenhouse effect.
Fleming, 2018 This manuscript will review the essence of the role of CO2 in the Earth’s atmosphere. The logic of CO2 involvement in changing the climate will be investigated from every perspective: reviewing the historical data record, examining in further detail the twentieth-century data record, and evaluating the radiation role of CO2 in the atmosphere—calculating and integrating the Schwarzschild radiation equation with a full complement of CO2 absorption coefficients. A review of the new theory of climate change—due to the Sun’s magnetic field interacting with cosmic rays, is provided. The application of this new theory is applied to climate-change events within the latter part of the Earth’s interglacial period. … The results of this review point to the extreme value of CO2 to all life forms, but no role of CO2 in any significant change of the Earth’s climate. … The results of this review point to the extreme value of CO2 to all life forms, but no role of CO2 in any significant change of the Earth’s climate. … Many believe and/or support the notion that the Earth’s atmosphere is a “greenhouse” with CO2 as the primary “greenhouse” gas warming Earth. That this concept seems acceptable is understandable—the modern heating of the Earth’s atmosphere began at the end of the Little Ice Age in 1850. The industrial revolution took hold about the same time. It would be natural to believe that these two events could be the reason for the rise in temperature. There is now a much clearer picture of an alternative reason for why the Earth’s surface temperature has risen since 1850. … There is no correlation of CO2 with temperature in any historical data set that was reviewed. The climate-change cooling over the 1940–1975 time period of the Modern Warming period was shown to be influenced by a combination of solar factors. The cause of the Medieval Warm Period and the Little Ice Age climate changes was the solar magnetic field and cosmic ray connection. When the solar magnetic field is strong, it acts as a barrier to cosmic rays entering the Earth’s atmosphere, clouds decrease and the Earth warms. Conversely when the solar magnetic field is weak, there is no barrier to cosmic rays—they greatly increase large areas of low-level clouds, increasing the Earth’s albedo and the planet cools. The factors that affect these climate changes were reviewed in “Solar magnetic field/cosmic ray factors affecting climate change” section. The calculations of “H2O and CO2 in the radiation package” section revealed that there is no net impact of CO2 on the net heating of the atmosphere. The received heat is simply redistributed within the atmospheric column. This result is consistent and explains the lack of CO2 correlations with observations in the past. The current Modern Warming will continue until the solar magnetic field decreases in strength. If one adds the 350-year cycle from the McCracken result to the center of the Maunder Minimum which was centered in 1680, one would have a Grand Minimum centered in the year 2030.
Holmes, 2018 In short, there is unlikely to be any significant net warming from the greenhouse effect on any planetary body in the parts of atmospheres which are >10kPa. Instead, it is proposed that the residual temperature difference between the effective temperature and the measured near-surface temperature, is a thermal enhancement caused by gravitationally-induced adiabatic auto compression, powered by convection. A new null hypothesis of global warming or climate change is therefore proposed and argued for; one which does not include any anomalous or net warming from greenhouse gases in the tropospheric atmospheres of any planetary body. … A decline of 6% in lower tropospheric tropical cloud cover (15°N–15°S) occurred 1984 – 2000 according to the international satellite cloud climatology project’s data [29]. These years are contained well with the 1975-2000 period of warming, and an observed 0.4°C rise in global temperatures occurred over the same period. Scatter diagrams [55] of low cloud cover vs global surface air temperatures indicate that a 1% fall in low clouds equates to a 0.07°C rise in surface air temperatures – hence this change in cloudiness accounts for the entire observed rise in global temperatures during the 1975-2000 period, leaving no room for any effect from growing greenhouse gases.
Ollila, 2018 The temperature effects of the water and CO2 are based on spectral analysis calculations, which show that water is 11.8 times stronger a GH gas than CO2 in the present climate. … There are essential features in the long-term trends of temperature and TPW [total precipitable water], which are calculated and depicted as mean values 11 years running. The temperature has increased about 0.4°C since 1979 and has now paused at this level. The long-term trend of TPW effects shows that it has slightly decreased during the temperature-increasing period from 1979 to 2000. This means that the absolute water amount in the atmosphere does not follow the temperature increase, but is practically constant, reacting only very slightly to the long-term trends of temperature changes. The assumption that relative humidity is constant and that it amplifies the GH gas changes over the longer periods by doubling the warming effects finds no grounds based on the behavior of the TWP [total precipitable water] trend. The positive water feedback exists only during the short-term ENSO events (≤4 years). … The validity of the IPCC model can be tested against the observed temperature. It turns out that the IPCC-calculated temperature increase for 2016 is 1.27°C, which is 49 per cent higher than the observed 0.85°C. This validity test means that the IPCC climate forcing model using the radiative forcing value of CO2 is too sensitive for CO2 increase, and the CS [climate sensitivity] parameter, including the positive water feedback doubling the GH gas effects, does not exist. … The CO2 emissions from 2000 onward represent about one-third of the total emissions since 1750, but the temperature has not increased, and it has paused at the present level. This is worthy proof that the IPCC’s climate model has overestimated human-induced causes and has probably underestimated natural causes like the sun’s activity changes, considering the historical temperatures during the past 2000 years. … The RF [radiative forcing] value for the CO2 concentration of 560 ppm is 2.16 Wm−2 according to equation (3), which is 42 per cent smaller than 3.7 Wm−2 used by the IPCC. The same study of Ollila (2014) shows that the CS [climate sensitivity] parameter λ is 0.27 K/(Wm−2), which means that there is no water feedback. Using this λ value, equation (3) gives a TCS [transient climate sensitivity] value of 0.6°C only. This same result is also reported by Harde (2014) using the spectral analysis method. …There are both theoretical- and measurement-based studies showing results that can be explained only by the fact that there is no positive water feedback. This result reduces the CS [climate sensitivity] by 50 per cent. Some research studies show that the RF [radiative forcing] value of carbon dioxide is considerably smaller than the commonly used RF value, according to the equation of Myhre et al. (1998). Because of these two causes, the critical studies show a TCS [transient climate sensitivity] of about 0.6°C instead of 1.9°C by the IPCC, a 200 per cent difference.
Liu and Chen, 2018 CO2 and temperature records at Mauna Loa, Hawaii, and other observation stations show that the correlation between CO2 and temperature is not significant. These stations are located away from big cities, and in various latitudes and hemispheres. But the correlation is significant in global mean data. Over the last five decades, CO2 has grown at an accelerating rate with no corresponding rise in temperature in the stations. This discrepancy indicates that CO2 probably is not the driving force of temperature change globally but only locally(mainly in big cities). We suggest that the Earth’s atmospheric concentration of CO2 is too low to drive global temperature change. Our empirical perception of the global warming record is due to the urban heat island effect: temperature rises in areas with rising population density and rising industrial activity. This effect mainly occurs in the areas with high population and intense human activities, and is not representative of global warming. Regions far from cities, such as the Mauna Loa highland, show no evident warming trend. The global monthly mean temperature calculated by record data, widely used by academic researchers, shows R~2=0.765, a high degree of correlation with CO2. However, the R~2 shows much less significance (mean R~2=0.024) if calculated by each record for 188 selected stations over the world. This test suggests that the inflated high correlation between CO2 and temperature(mean R~2=0.765-0.024=0.741) used in reports from the Intergovernmental Panel on Climate Change(IPCC) was very likely produced during data correction and processing. This untrue global monthly mean temperature has created a picture: human emission drives global warming.
Laubereau and Iglev, 2018 Using a simple 1-dimensional model the global warming of the surface is computed that is generated by the increase of GHG and the albedo change. A modest effect by the GHG of 0.08 K is calculated for the period 1880 to 1955 with a further increase by 0.18 K for 1955 to 2015. A larger contribution of 0.55 ± 0.05 K is estimated for the melting of polar sea ice (MSI) in the latter period, i.e. it notably exceeds that of the GHG and may be compared with the observed global temperature rise of 1.0 ± 0.1 K during the past 60 years. … In conclusion we wish to say that we have performed a study of the infrared properties of carbon dioxide, methane, dinitrogen-oxide and water to estimate their contribution to the global warming in 1880 – 2015. Our results suggest that the IR properties of the CO2 are responsible for ~ 20% of the mean temperature increase of the surface and notably less for CH4 and N2O.


