6 New Papers Link Arctic/North Atlantic
Climate Changes To Natural Factors
1. Natural variability/NAO/AMO “predominantly force ocean temperatures” and Greenland ice sheet melt
Hahn et al., 2018
“North Atlantic Natural Variability Modulates Emergence of Widespread Greenland Melt in a Warming Climate … Using reanalysis data and a large ensemble of climate model simulations, we find that a negative North Atlantic Oscillation and positive Atlantic Multidecadal Oscillation consistently promote heightened summer melt under various forcing conditions. Moreover, timing of widespread 21st century Greenland melt varies considerably between ensemble members due to different phasing of these modes of natural variability. These results indicate the importance of natural modes of variability across a range of external forcing conditions for interannual melt variability and the emergence of widespread Greenland melt. … North Atlantic warming in high melt years is driven by the negative NAO rather than the AMO (Hurrell & Deser, 2010). Downward (upward) turbulent heat flux anomalies over warmer (colder) ocean regions during high melt seasons further suggest that NAO-related wind and heat fluxes predominantly force ocean temperatures.”
(press release)
“The study, published in Geophysical Research Letters, found that when the NAO stays in its negative phase (meaning that air pressure is high over Greenland) it can trigger extreme ice melt in Greenland during the summer season. Likewise, the AMO, which alters sea surface temperatures in the North Atlantic, can cause major melting events when it is in its warm phase, raising the temperature of the region as a whole.”
2. Arctic sea ice and surface cooling/warming attributed to variations in the AMO
“The Arctic sea ice cover has been rapidly declining in the last two decades, concurrent with a shift in the Atlantic Multi-decadal Oscillation (AMO) to its warm phase around 1996/97. … We suggest that the cold AMO phase is important to regulate the atmospheric response to AASIC [Atlantic sector of the Arctic sea ice cover] decline and our study provides insight to the ongoing debate on the connection between the Arctic sea ice and the AO.”
“Following rapid cooling in the 1960s, much of the North Atlantic Ocean was characterized by a cold period during the 1970s and 1980s. This cold period was part of the multidecadal variability in sea surface temperatures known as the Atlantic Multidecadal Oscillation or AMO, which has a period of ∼60–80 years. During this cold period, below average air and sea temperatures predominated, increased ice cover was observed in those northern regions with seasonal sea ice, and evidence was found of reduced Atlantic inflow into the Northeast Atlantic Ocean. The ecological responses included a reduction in primary production and geographic shifts in zooplankton species. Also, there was a general southward expansion of arctic and boreal fish species and a retreat of the temperate species. Major fish stocks such as Atlantic cod off Greenland and Labrador/northern Newfoundland, as well as the Norwegian spring-spawning herring, collapsed commercially. These collapses were partly driven by climate-induced declines in growth rates and recruitment survival, as well as fishing. In contrast, in the more southern range of Atlantic cod, such as the North Sea, the opposite response occurred as the cool conditions led to improved growth rates and higher abundance. Long-term measurements in the English Channel documented the replacement of several warm-water species with more northern cold-water species. Benthic and nearshore species also underwent distributional shifts and changing abundances. Comparisons with the responses to the warm periods suggest that following the cold period of the 1970s and 1980s, the ecosystem in the 1990s and 2000s returned to conditions akin to what they were in the previous warm period of the 1930s–1950s. However, there were some notable exceptions, such as the continued low abundance of Atlantic cod off West Greenland and Labrador/northern Newfoundland.”
3. Arctic radiation budget “governed” by cloud cover changes
“The surface radiation budget of the Arctic Ocean plays a central role in summer ice melt and is governed by clouds and surface albedo. … Longwave and shortwave radiation are primary drivers in the surface heat budget during summer melt (Persson et al., 2002). The surface radiative balance consists of contributions from incoming shortwave radiation, reflected shortwave radiation, incoming longwave radiation, and outgoing longwave radiation. Clouds have a major impact on both incoming longwave and shortwave radiative fluxes. … Future impacts on net radiative balances will depend on both ice and cloud conditions. As the sea ice cover evolves towards more first year ice, greater melt pond coverage, and more open water, the area-averaged albedo will be less than the break-even albedo for much of the summer. This implies less melting under cloudy conditions than sunny. However, the net radiative balance will still likely be less under sunny skies at the beginning of the melt season in May and early June.”
4. Surface wind speeds “closely associated” with Arctic sea ice reduction during 1979-2009
“[W]e conducted a statistical analysis to examine overall relationships between surface winds, SST [sea surface temperature], and sea ice in the CBS [Chukchi and Beaufort Seas, Arctic Ocean], using the newly developed CBHAR data set. The result shows a significant negative correlation between the surface winds and SIC [sea ice concentration], further confirming that increased wind speeds are closely associated with the reduction in SIC [sea ice concentration] (Stegall and Zhang 2012) […] during September and October from 1979−2009. … A scatter plot of mean SIC [sea ice concentration] and wind speed anomalies, as well as the variation in wind speed anomalies […] demonstrat[e] a clear inverse linear relationship between surface wind speed and SIC [sea ice concentration] anomalies, with a correlation coefficient of −0.94 at a 99% level of significanceusing the t-test (Snedecor and Cochran 1989). This statistically suggests that surface wind speeds generally increase as SIC [sea ice concentration] decreases. … Taken together, the negative correlation between winds and SST [sea surface temperatures] over the OW and LIC areas can be attributed to reduced shortwave radiation due to increased cloudiness, increased upward sensible and latent heat fluxes, and strong cold advection from sea ice towards the north when strong winds are present, or vice versa when weak winds occur.”
[Neither CO2 concentration or anthropogenic forcing is mentioned anywhere in the paper as radiative factors affecting sea surface temperatures or sea ice concentrations during 1979-2009.]
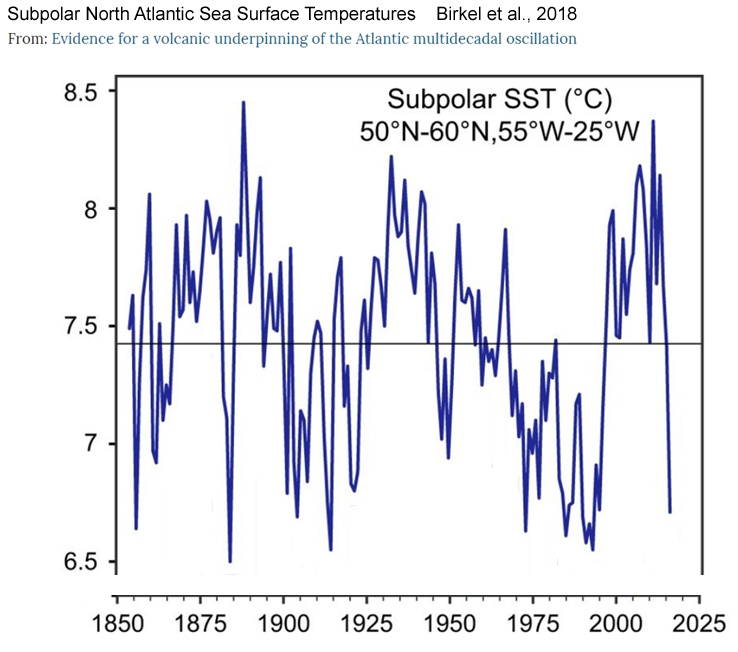
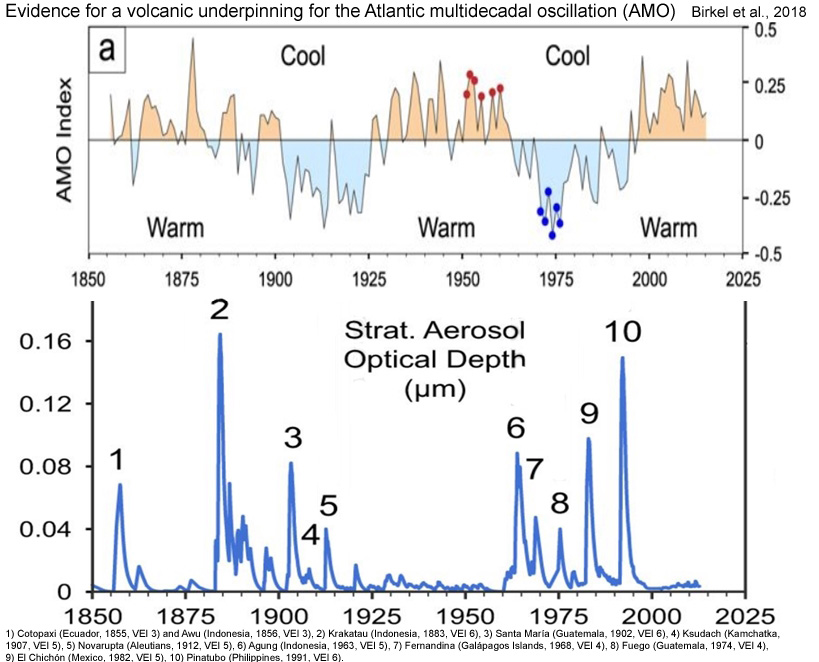
5. Volcanic activity “appear to underpin” sea surface temperature variations in the North Atlantic
“We find that cool intervals across the North Atlantic coincide with two distinct episodes of explosive volcanic activity (1880s–1920s and 1960s–1990s), where key eruptions include 1883 Krakatau, 1902 Santa María, 1912 Novarupta, 1963 Agung, 1982 El Chichón, and 1991 Pinatubo. Cool SST patterns develop in association with an increased prevalence of North Atlantic Oscillation (NAO)+ atmospheric patterns caused by stratospheric aerosol loading and a steepened poleward temperature gradient. NAO+ patterns promote wind-driven advection, evaporative cooling, and increased albedo from enhanced Saharan dust transport and anthropogenic aerosols. SSTs across the subpolar gyre are regulated by strength of low pressure near Iceland and the associated wind-driven advection of cold surface water from the Labrador Sea. This is contrary to an interpretation that subpolar SSTs are driven by changes in ocean overturning circulation. We also find that North Pacific and global mean SST declines can be readily associated with the same volcanic triggers that affect the North Atlantic. Thus, external forcing from volcanic aerosols appears to underpin multi-decade SST variability observed in the historical record.”