
 14
14 19
19
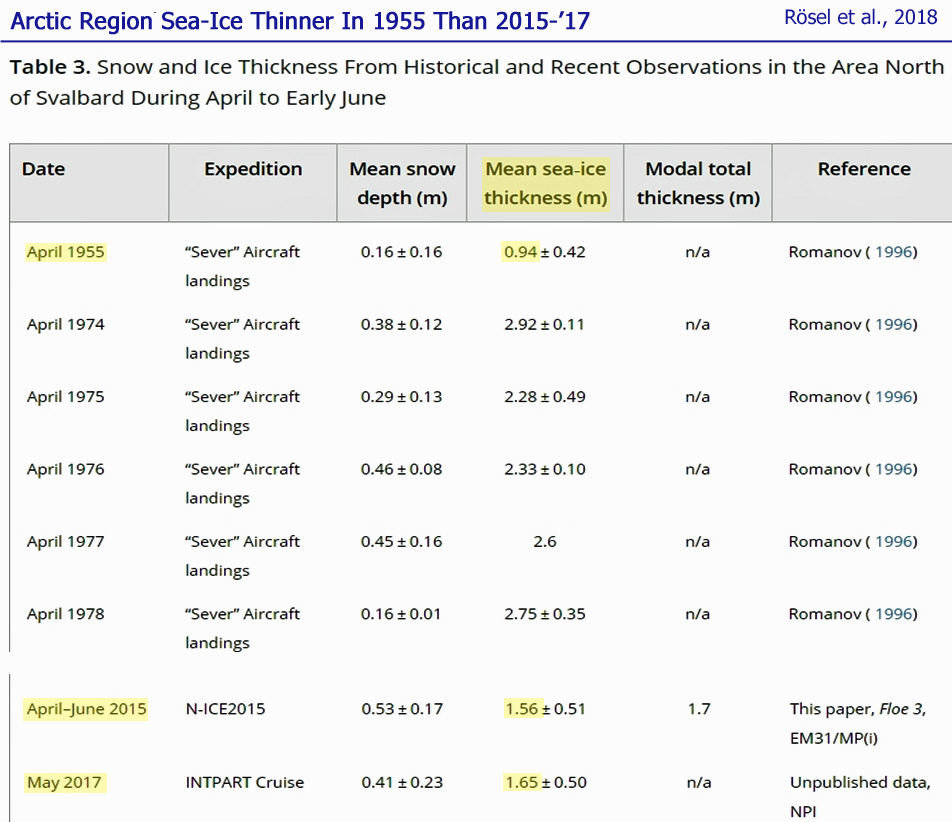
According to a new paper published in the Journal of Geophysical Research, the observed mean thickness of the sea ice in the region north of (Arctic) Svalbard was substantially thinner (0.94 m) in 1955 than it has been in recent years (~1.6 m, 2015/2017).
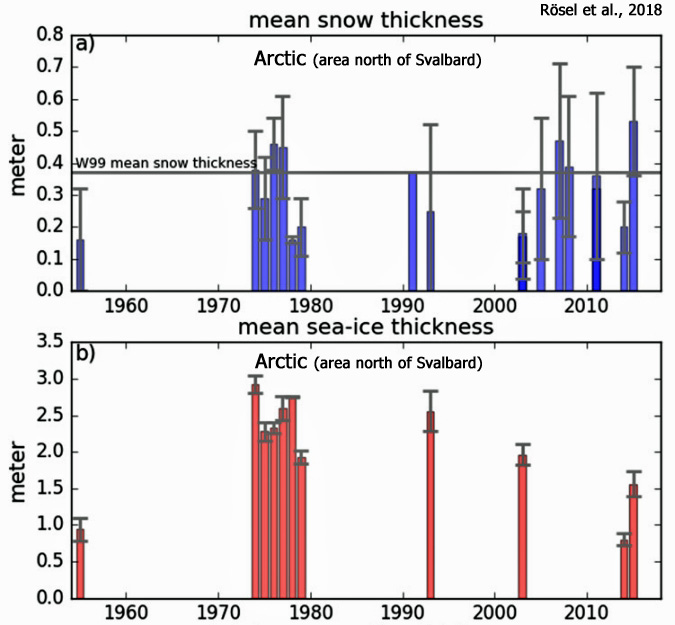
Graph Source: Rösel et al., 2018
In 1955, the atmospheric CO2 concentration hovered around 315 ppm, about 90 ppm lower than today’s CO2 values.
It is widely assumed that the steep and substantial rise in CO2 concentration since the 1950s is largely responsible for warming the Arctic, and consequently the decline in the Arctic’s sea ice volume and extent (IPCC, 2013). This assumption is significantly predicated on the observation that sea ice has undergone precipitous losses since the 1970s, which is when the satellite era began.
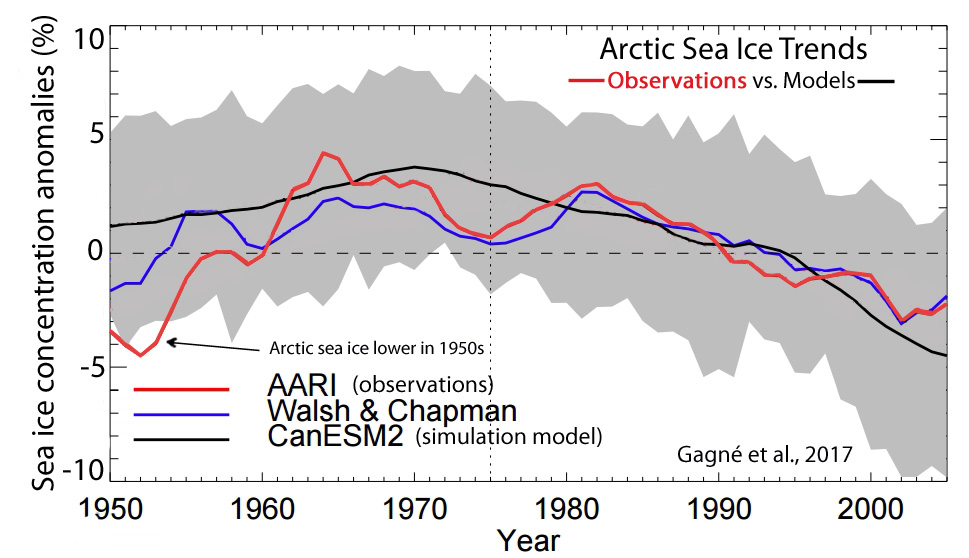
However, longer-term observational data do not appear to support the conclusion that Arctic region sea ice is driven by linear trends in atmospheric CO2 concentration. Indeed, there is evidence that Arctic sea ice extent was comparable or lower than now in the 1940s and 1950s (for example, see this annotated graph from Gagné et al., 2017). Several other recently published papers also fail to support a CO2 – Arctic climate connection, as detailed in several articles found here at NoTricksZone during 2018.
1. 20 New Papers Crush Claims Of A Man-Made Link To Arctic Climate Change, Glacier Retreat, Sea Ice
2. Groundbreaking AGW-Undermining Study: Greenland’s Warming, Ice Loss Due To Geothermal Heat
3. Another New Paper Shows Arctic Sea Ice Has Been INCREASING Overall Since The 1930s
4. 12 New Papers Affirm A 21st Century Cessation Of Arctic Warming And A Rapid Cooling Across Antarctica
5. Arctic Temps 2°-6°C Warmer Than Today With 4.5 Fewer Months Of Sea Ice Coverage 2,000 Years Ago
6. New ‘Consensus’ Science: HALF Of 1979-Present Arctic Warming & Ice Loss Is Natural
7. In 2015, Climate Scientists Wrecked Their Own CO2-Forced ‘Polar Amplification’ Narrative
8. Activists Continue To Peddle Unsupportable Claims Of NEVER-BEFORE Climate Alarm, Ignoring New Science
Regional Arctic sea ice was thicker than now in the 1950s?
In another newly published paper, observations from an Arctic region north of Svalbard affirm that sea ice thicknesses were indeed much higher than today during the 1970s, or when the linearly-decreasing sea ice trend documented by satellites (conveniently) commenced.
However, looking closely at Table 3 (shown in the introductory graph above) from the same paper, we see that sea ice thickness values may have been lowerin the mid-1950s (0.94 m) than they are today (~1.6 m thicknesses on average).
If sea ice was was thinner than it is now during the same period of time that CO2 concentrations were substantially lower than they are now, this documented observational evidence appears to again undermine the conclusion that CO2 concentration rises are significantly connected to sea ice losses – or to the Arctic climate in general.
Rösel et al., 2018
Thin Sea Ice, Thick Snow, and Widespread Negative
Freeboard Observed During N‐ICE 2015 North of Svalbard
“We present a continuous time series of in situ measurements from the N‐ICE2015 expedition from January to June 2015 in the Arctic Basin north of Svalbard, comprising snow buoy and ice mass balance buoy data and local and regional data gained from electromagnetic induction (EM) surveys and snow probe measurements from four distinct drifts.
“The observed mean snow depth of 0.53 m for April to early June [2015] is 73% above the average value of 0.30 m from historical [1955, 1970s] and recent observations in this region, covering the years 1955–2017.”
“The modal total ice and snow thicknesses, of 1.6 and 1.7 m [2015] measured with ground‐based EM and airborne EM measurements in April, May, and June 2015, respectively, lie below the [1970s] values ranging from 1.8 to 2.7 m, reported in historical observations from the same region and time of year [but well above the sea-ice thickness values of 0.94 m for 1955].”
