Sea ice habitat for polar bears has not become progressively worse each year during their season of critical feeding and mating, as some scaremongers often imply. It’s true that absolute extent of Arctic ice is lower this spring than it was in 1979. However, according to NSIDC Masie figures, polar bear habitat at mid-May registers about 12 million km2, just as it did in 2006 (although it is distributed a little differently); other data show spring extent has changed little since a major decline occurred in 1989, despite ever-rising CO2 levels.
In other words, there has been virtually no change in sea ice cover over the last 12 years, despite the fact that atmospheric CO2 has now surpassed 410 parts per million, a considerable and steady increase over levels in 2006 which were about 380 ppm (see below, from the Scripps Oceanographic Laboratory, included in the Washington Post story 3 May 2018):

Not only that, but if rising CO2 levels were responsible for the decline of sea ice and implied effects on polar bears since 1979 (when CO2 levels were around 340 ppm), why has spring ice extent been so variable since 1989 (when the first big decline occurred) but so little changed overall since then? See the NSIDC graph below for April:

This year on day 134 (14 May), global ice cover registered 12.3 mkm2:

In 2016 on the same day, the overall extent was much the same but there was more ice in the Chukchi and Bering Seas and less in the eastern Beaufort:

More close-up charts of different regions below for 2018 vs. 2016, showing more detail.
Here’s the close-up for Canada on the same date (14 May 2018):

Compare the above to 2016 a day earlier (13 May), below:

This year, virtually all of Hudson Bay, Hudson Strait, Foxe Basin and Davis Strait were covered in thick first year ice (>1.2m thick) by the first week in May:

Compare the above to conditions in 2016 the first week of May, when medium first year ice (70-120 cm thick) was more extensive and widening shore leads were prominent:

In Western Canada and eastern Alaska this year, most of the region was covered by thick, concentrated, multiyear ice by the first week in May:

Compare the above to condition in 2016 in the same area, when a major polynya (open water) was beginning to form due to prevailing winds at the time:

Eastern Arctic Canada in the first week of May this year was a mix of thick, multiyear ice and thick first year ice (>1.2 m):

Compare the above to Eastern Arctic Canada in the first week of May 2016 (below), was also a mix of thick, multiyear ice and thick first year ice (>1.2 m) but more thin and medium first year ice and more open water:

In the eastern Atlantic, ice in the Barents Sea was quite extensive at the end of April:

However, by 14 May this year the ice was breaking up between Svalbard and Franz Josef Land:

Back in 2016 at about the same date, there was more concentrated ice between the two archipelagos but less concentrated pack ice northeast of Nova Zemlya (that long skinny island east of Franz Josef Land):

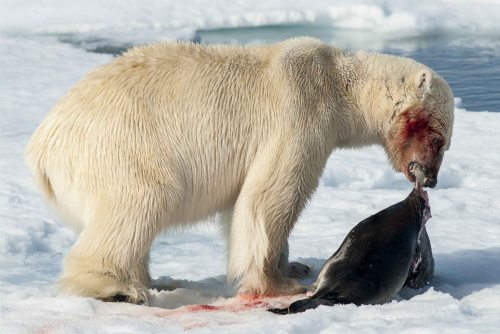
On-going polar bear research around Svalbard shows no significant negative effects of lower-than-average spring sea ice in this region (Crockford 2018).
CONCLUSION
There was still plenty of ice in the spring of 2018 to meet the needs of polar bears. There has been little material difference in polar bear sea ice habitat during April/May — the most critical time period for polar bears — since 2006. Moreover, there has been somewhat less ice during this period in recent years than in 1979-1988 but little change since 1989, suggesting that spring sea ice levels are not particularly sensitive to rising atmospheric CO2 levels. Regardless, there is no evidence that this slight change in spring ice extent has caused any negative effects on polar bear health and survival: virtually all efforts to date have been focused on making correlations with reduced summer sea ice.
REFERENCES
Crockford, S.J. 2018. State of the Polar Bear Report 2017. Global Warming Policy Foundation Report #29. London. Pdf here: State of the Polar Bear Report 2017