
Global ocean temperatures continue to fall and are now colder than they were before the record 2015/16 El Nino.
The best context for understanding decadal temperature changes comes from the world’s sea surface temperatures (SST), for several reasons:
- The ocean covers 71% of the globe and drives average temperatures;
- SSTs have a constant water content, (unlike air temperatures), so give a better reading of heat content variations;
- A major El Nino was the dominant climate feature in recent years.
HadSST is generally regarded as the best of the global SST data sets, and so the temperature story here comes from that source, the latest version being HadSST3. More on what distinguishes HadSST3 from other SST products at the end.
The Current Context
The chart below shows SST monthly anomalies as reported in HadSST3 starting in 2015 through February 2018.
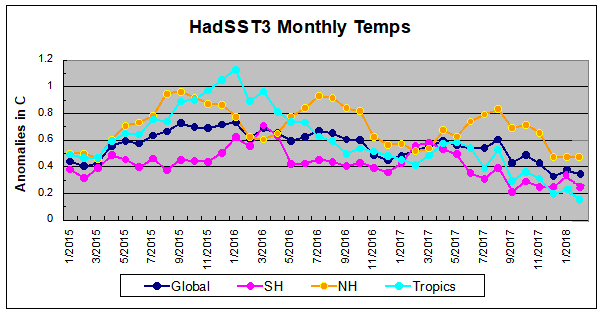
Note that higher temps in 2015 and 2016 were first of all due to a sharp rise in Tropical SST, beginning in March 2015, peaking in January 2016, and steadily declining back below its beginning level. Secondly, the Northern Hemisphere added three bumps on the shoulders of Tropical warming, with peaks in August of each year. Also, note that the global release of heat was not dramatic, due to the Southern Hemisphere offsetting the Northern one.
A global cooling pattern has persisted, seen clearly in the Tropics since its peak in 2016, joined by NH and SH dropping since last August. An upward bump occurred last October, and again in January 2018. Now the cooling has resumed in February with only the NH showing a slight increase. As will be shown in the analysis below, 0.410C has been the average global anomaly since 1995 and this month remains lower at 0.349C. SH erased the January bump while the tropics reached a new low of 0.155 for this period.
Global and NH SSTs are the lowest since 3/2014, while SH and Tropics SSTs are the lowest since 3/2012.
A longer view of SSTs
The graph below is noisy, but the density is needed to see the seasonal patterns in the oceanic fluctuations. Previous posts focused on the rise and fall of the last El Nino starting in 2015. This post adds a longer view, encompassing the significant 1998 El Nino and since. The color schemes are retained for Global, Tropics, NH and SH anomalies. Despite the longer time frame, I have kept the monthly data (rather than yearly averages) because of interesting shifts between January and July.
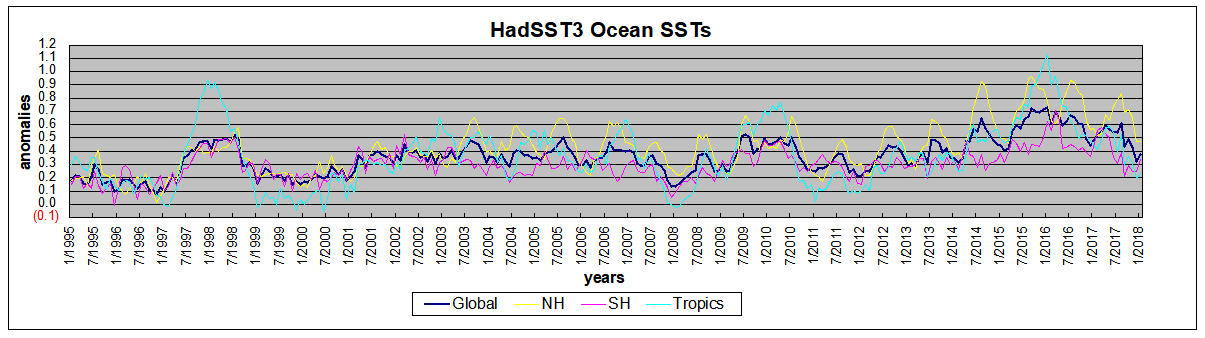
Open image in new tab for sharper detail.
1995 is a reasonable starting point prior to the first El Nino. The sharp Tropical rise peaking in 1998 is dominant in the record, starting Jan. ’97 to pull up SSTs uniformly before returning to the same level Jan. ’99. For the next 2 years, the Tropics stayed down, and the world’s oceans held steady around 0.2C above 1961 to 1990 average.
Then comes a steady rise over two years to a lesser peak Jan. 2003, but again uniformly pulling all oceans up around 0.4C. Something changes at this point, with more hemispheric divergence than before. Over the 4 years until Jan 2007, the Tropics go through ups and downs, NH a series of ups and SH mostly downs. As a result the Global average fluctuates around that same 0.4C, which also turns out to be the average for the entire record since 1995.
2007 stands out with a sharp drop in temperatures so that Jan.08 matches the low in Jan. ’99, but starting from a lower high. The oceans all decline as well, until temps build peaking in 2010.
