
Brand new scientific findings in a just published paper by Lansner and Pepke Pedersen appearing in the journal of Energy and Environment cast global warming science into more uncertainty.
The findings tell us that ocean cycles and their impacts have not been adequately accounted for in computing global temperatures.
BEST approach “flat wrong”
The paper would mean that the entire approach of, for example, BEST and others to present global temperature data is “flat wrong”, claims coauthor Frank Lansner.
These approaches use one temperature trend for each area that they call “expected regional trend” and then they adjust all data to resemble this trend. But Lansner points out this is inadequate and that TWO trends need to be accepted instead – depending on the topography: one for stations exposed to ocean air affects (OAA), and one for stations sheltered from oceanic air affects (OAS). “In fact between the two extremes of temperature trends we have a grey zone of temperature trends that also are fully valid,” Lansner wrote in an e-mail response to an inquiry from NoTricksZone.
“Moreover, any dataset used to evaluate climate related changes in the heat balance over the earth should strive to use only OAS temperature data trends,” Lansner wrote. “It’s necessary to reduce noise from ocean temperature trends as much as possible if we want to read the signal from changing heat balances over the Earth. Go to the valleys and read the thermometers if you want to learn about the actual changes in the heat balance over the Earth.”
Ultimately this gets right to the heart of the whole CO2 vs natural factors debate.
The paper’s abstract:
Temperature data 1900–2010 from meteorological stations across the world have been analyzed and it has been found that all land areas generally have two different valid temperature trends. Coastal stations and hill stations facing ocean winds are normally more warm-trended than the valley stations that are sheltered from dominant oceans winds.
Thus, we found that in any area with variation in the topography, we can divide the stations into the more warm trended ocean air-affected OAA] stations, and the more cold-trended ocean air-sheltered [OAS] stations. We find that the distinction between ocean air-affected and ocean air-sheltered stations can be used to identify the influence of the oceans on land surface. We can then use this knowledge as a tool to better study climate variability on the land surface without the moderating effects of the ocean.
We find a lack of warming in the ocean air sheltered temperature data – with less impact of ocean temperature trends – after 1950. The lack of warming in the ocean air sheltered temperature trends after 1950 should be considered when evaluating the climatic effects of changes in the Earth’s atmospheric trace amounts of greenhouse gasses as well as variations in solar conditions.
Figure 19 of the paper:
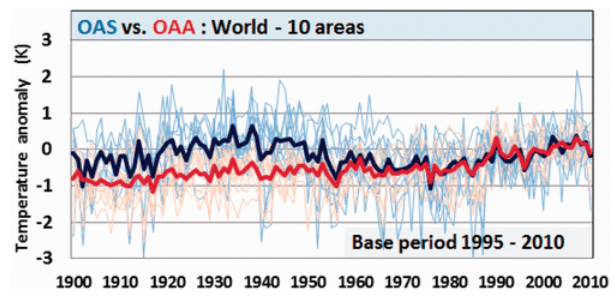
Figure 19. Ocean air sheltered (OAS) and ocean air affected (OAA) temperatures, all regions.
This all means that when the ocean effects are minimized as well as possible, the heat trend from worldwide temperature station data diminishes.
Lansner wrote: “CO2 theory apparently does not work in valleys. Rather, we need ocean-trends to affect temperature data to see alarming temperature rise after 1950. Areas without ocean noise in data show that the heat balance over the Earth today resembles 1930-50.”
Lansner informed NoTricksZone by e-mail: “This goes right in the heart of the whole Sun vs. CO2 debate.” He added:
The little ice-age centuries led to a very cold ocean around 1900-1920 and so ocean and ocean-affected stations were not able to show the warming around 1920-30 so well. The ocean kept the warming hidden to some degree. Ocean temperature rise was somewhat delayed for decades it appears. That’s why ocean temperatures do not well reflect the heat balance over the Earth 1920-50 – unlike OAS areas valleys that reflected the change in heat balance rapidly. Thus it appears OAS data are the data best suited for evaluating the heat balance over the Earth.”
This spells more potential trouble for the suspicion that CO2 has been the main driver of the global temperature over the past century.
==============================
Frank Lansner, civil engineer from the Danish Technical University, 1998. Main areas are Microbiology and Biochemistry and has worked as a software developer since 1998.
Jens Olaf Pepke Pedersen has a PhD in physics from the University of Aarhus, Denmark. He worked at the Danish Center for Earth System Science from 1998-2003 and since 2003 has worked at the Danish National Space Institute. His main focus is climate change and Earth System modelling of both past and future climate.

