
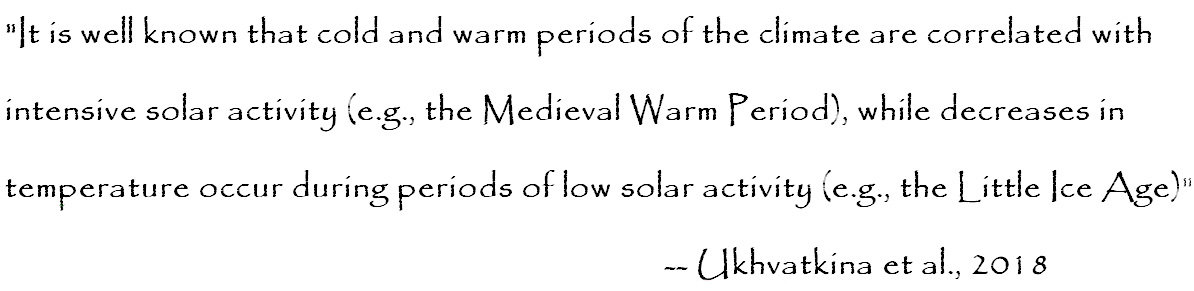
Graph Source: Herrera et al., 2015
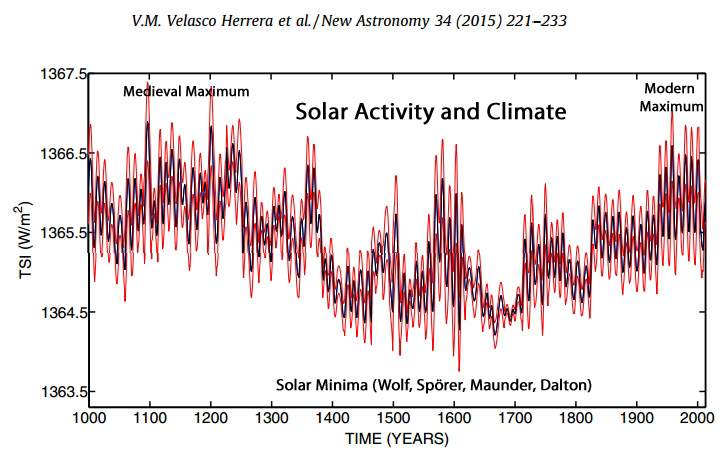
Graph Source: Russell et al., 2010
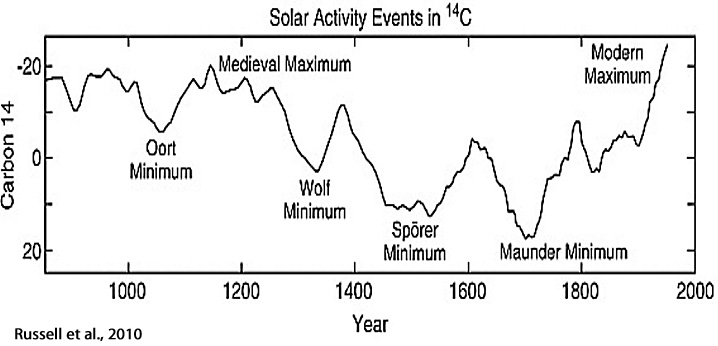
1. Oliva et al., 2018
Cold period during 1645–1706 (Maunder solar minimum). Cold period during 1810–1838 (Dalton solar minimum). Warmperiod during the mid-20th and 21st centuries (modern solar maximum).
LIA [Little Ice Age] was characterized by a cold phase having lower annual and summer temperatures relative to the long-term mean, consistent with the solar minima. … The record shows rapid cooling since the start of the Spörer Minimum, which intensified during the Maunder Minimum (with the lowest estimated temperature being 2 °C lower than the recent average). A later increase in the temperature and another slight cooling probably coincided with the Dalton Minimum. Particularly cold winters occurred during the MCA (from 1090 to 1179), during the LIA onset (1350) and from the late 15th to early 16th centuries. Winter temperatures would have been approximately 0.5 °C lower during the LIA (1500–1900) than during the 20th century. … [T]he Maunder Minimum coincided with a cold period from 1645 to 1706, and the Dalton Minimum (1796–1830) is correlated with a cold stage spanning the years from 1810 to 1838.
Four warm periods (1626–1637, 1800–1809, 1845–1859, and 1986–2012) coincided with periods of increased solar activity.
The gradual increase in temperature during the second half of the 19th century resulted in significant glacier retreat, with rates of receding [in the second half of the 19th century] similar to those recorded during the last decades of the 20th century and in the early 21st century (Chueca et al., 2008). … The colder climate of the LIA was accompanied by severe droughts, floods, and cold/heat waves that showed significant spatio-temporal variation across the Iberian mountains.
The 20th century did not show unprecedented warmth over the last 800 years.
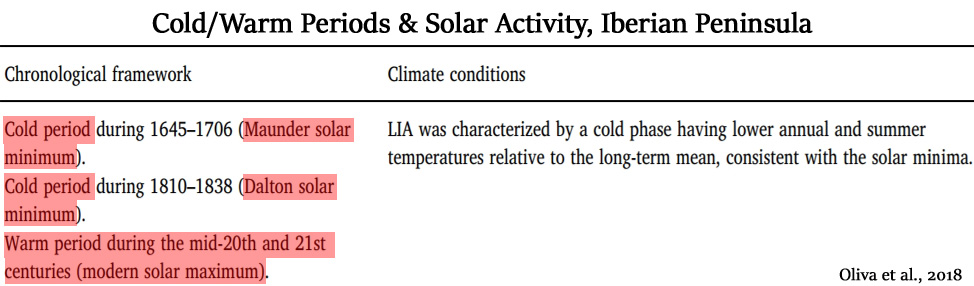
2. Ukhvatkina et al., 2018
It is well known that cold and warm periods of the climate are correlated with intensive solar activity (e.g., the Medieval Warm Period), while decreases in temperature occur during periods of low solar activity (e.g., the Little Ice Age; Lean and Rind, 1999; Bond et al., 2001).
Long cold periods from 1643 to 1667 and from 1675 to 1690 that were revealed for another territory (Lyu et al., 2016; Wilson et al., 2016) coincided with the Maunder Minimum (1645–1715), an interval of decreased solar irradiance (Bard et al., 2000). The coldest year in this study (1662) was revealed in this period too. The Dalton minimum period centered in 1810 is also notable. … We suppose that a 9-year cycle may be related to solar activity, as, first of all, many authors showed influence of solar activity on the climate variability (Bond et al., 2001; Lean and Rind, 1999; Lean, 2000; Mann et al., 2009; Zhu et al., 2016). Secondly, the significant correlation between of the August–December minimum temperature reconstruction and TSI [total solar irradiance] can be regarded as additional evidence of this assumption. Finally, there is a coincidence of the reconstructed cold periods with the Maunder Minimum (1645–1715) and the Dalton minimum period centered in 1810. The solar activity influence in the region is traditionally associated with an indirect effect on the circulation of the atmosphere (Erlykin et al., 2009; Fedorov et al., 2015).
In the second half of the 20th century the solar radiation intensity changes contributed to more intensive warming of the equatorial part of the Pacific Ocean and more active inflow of warm air masses to the north (Fedorov et al., 2015).
Close periodicity is revealed in long-term climate reconstructions and is linked to the quasi-200-year solar activity cycle in other studies (Raspopov et al., 2008, 2009). Raspopov et al. (2008) showed that in tree-ring-based reconstructions the cycle varies from 180 to 230 years. Moreover, the high correlation between the minimum temperature reconstructions and TSI, and also the revealed link between the reconstructed temperatures and solar activity minima, lead us to suppose that the solar activity may be the driver of the 200-year cycle. Such climate cycling, linked not only to temperature but also to precipitation, is revealed for the territories of Asia, North America, Australia, the Arctic, and the Antarctic (Raspopov et al., 2008). At the same time, the 200-year cycle (de Vries cycle) may often have a phase shift from some years to decades and correlates not only positively but also negatively with climatic fluctuations depending on the character of the nonlinear response of the atmosphere– ocean system within the scope of the region (Raspopov et al., 2009). According to Raspopov et al. (2009), the study area is in the zone that reacts with a positive correlation to solar activity, though the authors note that we should not expect a direct response because of the nonlinear character of the atmosphere–ocean system reaction to variability in solar activity (Raspopov et al., 2009). Taking into consideration this fact and that the cold and warm periods shown in our reconstruction are slightly shifted compared with more continental areas and the whole Northern Hemisphere, we can say that the reconstruction of minimum August–December temperatures reflects the global climate change process in aggregate with the regional characteristics of the study area.


