More Evidence of the Great 21st Century Warming Pause
Those who continue to deny the existence of the current warming pause would be wise to accept the reality of the data presented here by Xie et al. and elsewhere by so many others. It does exist, and it does add to the ever-growing mountain of evidence that warming due to rising atmospheric CO2 concentrations is unlikely to be dangerous.
Paper Reviewed
Xie, Y., Huang, J. and Liu, Y. 2017. From accelerated warming to warming hiatus in China. International Journal of Climatology 37: 1758-1773.
One of the many conundrums facing climate alarmists — who predict that dangerous future global warming will result from increasing concentrations of atmospheric CO2 — is the existence of the aptly-named “warming hiatus.” Also referred to as the “warming pause,” this phenomenon describes a nearly two-decade-long leveling off of global temperatures despite a ten percent increase in atmospheric CO2 concentration since 1998. The significance of these observations resides in the fact that all climate models project that temperatures should not be levelling off, but should be increasing (despite interannual variability) in direct consequence of the ongoing rise in atmospheric CO2.
The fact that a warming hiatus does exist does not bode well for the Climate Industrial Complex, which requires dire projections and global warming scare stories to maintain its multi-billion dollar strangle-hold on the federal budget. Any hint that the model projections are off and that dangerous global warming is unlikely to occur is a threat to their theory and livelihood; and, therefore, there have been a number of attempts by die-hard climate alarmists to deny, deride and destroy any and all discussion of the great 21st century temperature pause (see, for example, Karl et al., 2015 and Lewandowsky et al., 2015). Yet despite such efforts, researchers continue to document the existence of the hiatus (see, for example, Koska and Xie, 2013 and Guan et al., 2015), as well as the most recent scientific team of Xie et al. (2017).
Focusing their attention on Asia, it was the goal of these three Chinese researchers to examine “the robustness of the warming hiatus in China.” To accomplish their objective, they performed a series of analyses on both monthly and daily mean surface air temperature data, which they obtained from the Climate Research Unit (CRU) of the University of East Anglia (Harris et al., 2014) and the China Meteorological Administration (CMA), respectively.
And what did those analyses reveal?
In the words of Xie et al., they say that “using the CRU grid data and CMA regular surface meteorological observations, we showed the robustness of the warming hiatus that occurred in China,” which “was mainly induced by the cooling trend during the cold seasons.” Indeed, as shown by the black lines in the figure below, the annual mean temperature of both datasets increased through 1998, but thereafter a warming pause is evident (see the gray-shaded portion of the record). And, as revealed by the solid blue lines in the figure, this pause is clearly dominated by a cooling trend during the cold months of the year (November through March).
Those who continue to deny the existence of the current warming pause would be wise to accept the reality of the data presented here by Xie et al. and elsewhere by so many others. It does exist, and it does add to the ever-growing mountain of evidence that warming due to rising atmospheric CO2 concentrations is unlikely to be dangerous. It is time for policy makers around the world to wise up to this reality and shut down the climate-warming cabal by cutting climate change research funding and pulling out of the Paris Accord and the Rio Framework Convention.
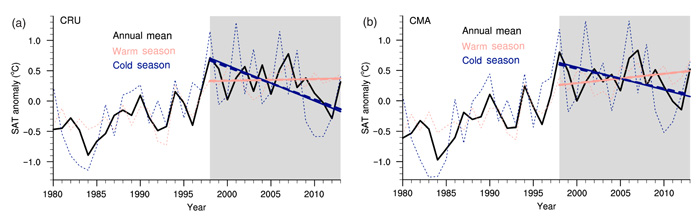
Figure 1. (Left Panel) Surface air temperature (SAT) anomaly time series averaged over China relative to the 1981-2010 reference period from the Climatic Research Unit (CRU) database. The solid lines are the linear trend lines based on the least squares estimator for 1998-2013 for warm (May-Sep) and cold (Nov-Mar) seasons, respectively, while the corresponding thick dashed lines are results from Mann-Kendall analysis. The gray shaded area indicates the recent warming hiatus period 1998-2013.. (Right Panel) Same as the left panel, but for results from China Meteorological Administration (CMA) dataset. Source: Xie et al. (2017).